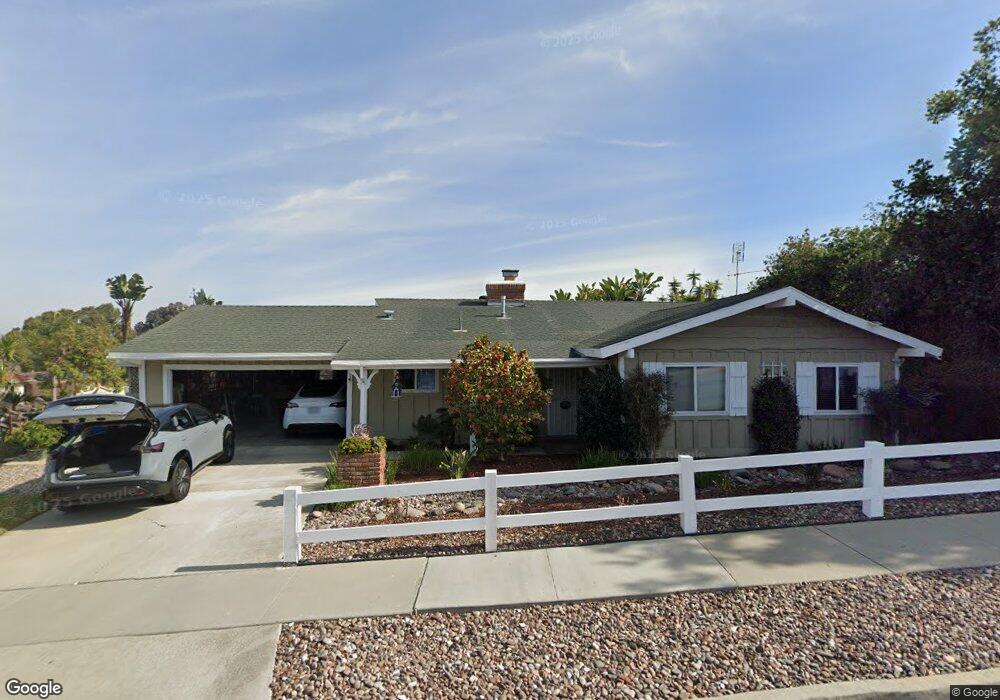
6163 Branting St San Diego, CA 92122
University City NeighborhoodEstimated Value: $1,428,647 - $1,704,000
3
Beds
2
Baths
1,481
Sq Ft
$1,045/Sq Ft
Est. Value
About This Home
This home is located at 6163 Branting St, San Diego, CA 92122 and is currently estimated at $1,547,662, approximately $1,045 per square foot. 6163 Branting St is a home located in San Diego County with nearby schools including Spreckels Elementary School, Standley Middle School, and University City High School.
Ownership History
Date
Name
Owned For
Owner Type
Purchase Details
Closed on
Sep 4, 2022
Sold by
Gordon David W and Gordon Terry L
Bought by
Terry L Gordon And David W Gordon Living Trus
Current Estimated Value
Purchase Details
Closed on
Oct 19, 2012
Sold by
C B Western Equities Inc
Bought by
Gordon David W and Gordon Terry L
Home Financials for this Owner
Home Financials are based on the most recent Mortgage that was taken out on this home.
Original Mortgage
$605,066
Interest Rate
3.36%
Mortgage Type
VA
Purchase Details
Closed on
Aug 2, 2012
Sold by
Sun West Mortgage Company Inc
Bought by
C B Western Equities Inc
Purchase Details
Closed on
Jan 19, 2012
Sold by
Mindrup Mark
Bought by
Sun West Mortgage Company Inc
Purchase Details
Closed on
Mar 1, 1996
Sold by
Parsons Dorothy L
Bought by
Parsons Dorothy L
Create a Home Valuation Report for This Property
The Home Valuation Report is an in-depth analysis detailing your home's value as well as a comparison with similar homes in the area
Home Values in the Area
Average Home Value in this Area
Purchase History
| Date | Buyer | Sale Price | Title Company |
|---|---|---|---|
| Terry L Gordon And David W Gordon Living Trus | -- | -- | |
| Gordon David W | $627,500 | Fidelity National Title Co | |
| C B Western Equities Inc | $392,000 | Fidelity National Title Co | |
| Sun West Mortgage Company Inc | $594,031 | Old Republic | |
| Parsons Dorothy L | -- | -- |
Source: Public Records
Mortgage History
| Date | Status | Borrower | Loan Amount |
|---|---|---|---|
| Previous Owner | Gordon David W | $605,066 |
Source: Public Records
Tax History Compared to Growth
Tax History
| Year | Tax Paid | Tax Assessment Tax Assessment Total Assessment is a certain percentage of the fair market value that is determined by local assessors to be the total taxable value of land and additions on the property. | Land | Improvement |
|---|---|---|---|---|
| 2025 | $7,126 | $762,097 | $630,788 | $131,309 |
| 2024 | $7,126 | $747,155 | $618,420 | $128,735 |
| 2023 | $8,922 | $728,144 | $594,407 | $133,737 |
| 2022 | $8,805 | $728,144 | $594,407 | $133,737 |
| 2021 | $8,743 | $713,867 | $582,752 | $131,115 |
| 2020 | $8,636 | $706,548 | $576,777 | $129,771 |
| 2019 | $8,481 | $692,695 | $565,468 | $127,227 |
| 2018 | $7,927 | $679,114 | $554,381 | $124,733 |
| 2017 | $7,737 | $665,799 | $543,511 | $122,288 |
| 2016 | $7,613 | $652,745 | $532,854 | $119,891 |
| 2015 | $7,499 | $642,942 | $524,851 | $118,091 |
| 2014 | $7,380 | $630,348 | $514,570 | $115,778 |
Source: Public Records
Map
Nearby Homes
- 2925 Fried Ave
- 3003 Fried Ave
- 5864 Lamas St
- 2712 Angell Ave
- 6036 Tulane St
- 4085 Rosenda Ct Unit 259
- 4095 Rosenda Ct Unit 249
- 3965 Camino Lindo Unit 194
- 4145 Porte de Merano Unit 128
- 3935 Caminito Silvela
- 7825 Camino Tranquilo Unit 26
- 7837 Camino Tranquilo
- 4210 Porte de Palmas Unit 28
- 8340 Via Sonoma Unit F
- 8280 Caminito Sonoma
- 5822 Stadium St
- 7849 Camino Glorita
- 3542 Governor Dr
- 8370 Via Sonoma Unit F
- 8037 Caminito Mallorca
- 2933 Briand Ave
- 6151 Branting St
- 6162 Branting St
- 2952 Ducommun Ave
- 6207 Branting St
- 2945 Briand Ave
- 6202 Branting St
- 2966 Ducommun Ave
- 6152 Branting St
- 2930 Briand Ave
- 2986 Ducommun Ave
- 2920 Ducommun Ave
- 6210 Branting St
- 2957 Briand Ave
- 2946 Briand Ave
- 6215 Branting St
- 6165 Stresemann St
- 3004 Ducommun Ave
- 6153 Stresemann St
- 6177 Stresemann St