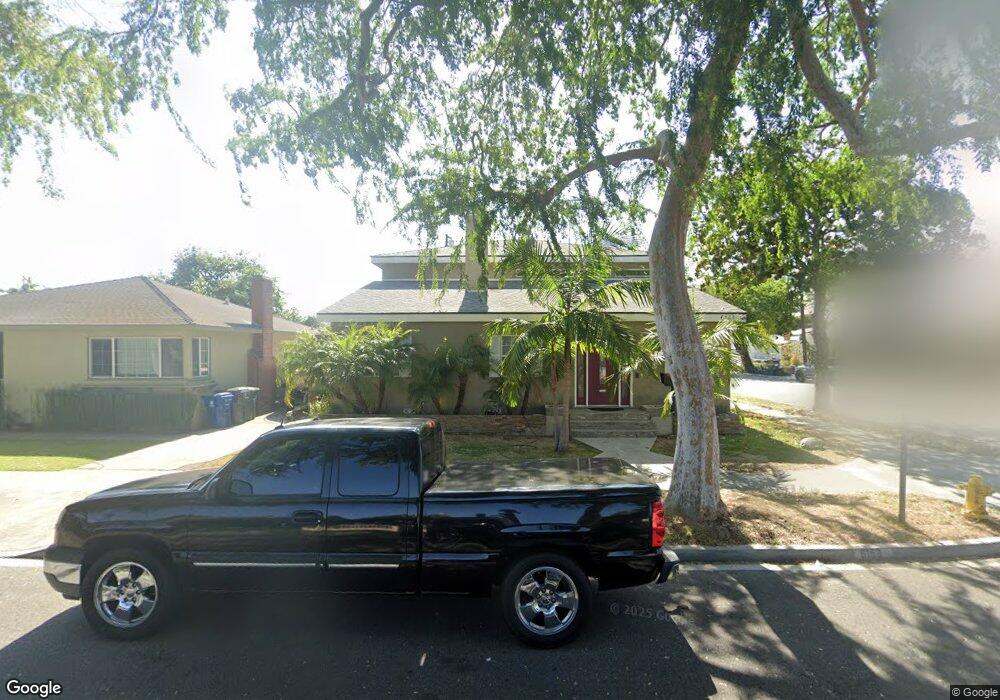
6163 Pimenta Ave Lakewood, CA 90712
Collins NeighborhoodEstimated Value: $928,000 - $1,096,000
3
Beds
4
Baths
2,551
Sq Ft
$398/Sq Ft
Est. Value
About This Home
This home is located at 6163 Pimenta Ave, Lakewood, CA 90712 and is currently estimated at $1,016,381, approximately $398 per square foot. 6163 Pimenta Ave is a home located in Los Angeles County with nearby schools including Captain Raymond Collins School, Leona Jackson Middle School, and Buena Vista High School.
Ownership History
Date
Name
Owned For
Owner Type
Purchase Details
Closed on
Mar 19, 2018
Sold by
Calderon Matthew
Bought by
Calderon Matthew and Calderon Debi J
Current Estimated Value
Home Financials for this Owner
Home Financials are based on the most recent Mortgage that was taken out on this home.
Original Mortgage
$410,000
Interest Rate
4.32%
Mortgage Type
New Conventional
Purchase Details
Closed on
Jan 18, 2011
Sold by
Mcquiston Larry L and Mcquiston Linda L
Bought by
Calderon Matthew and Calderon Debi J
Home Financials for this Owner
Home Financials are based on the most recent Mortgage that was taken out on this home.
Original Mortgage
$424,297
Interest Rate
4.75%
Mortgage Type
FHA
Purchase Details
Closed on
Feb 18, 2009
Sold by
Calderon Debi J
Bought by
Calderon Debi J
Purchase Details
Closed on
Aug 13, 2008
Sold by
Mcquiston Larry L and Mcquiston Linda L
Bought by
Mcquiston Larry L
Create a Home Valuation Report for This Property
The Home Valuation Report is an in-depth analysis detailing your home's value as well as a comparison with similar homes in the area
Home Values in the Area
Average Home Value in this Area
Purchase History
| Date | Buyer | Sale Price | Title Company |
|---|---|---|---|
| Calderon Matthew | -- | Unisource | |
| Calderon Matthew | -- | Lsi Title Company | |
| Calderon Debi J | -- | None Available | |
| Mcquiston Larry L | -- | None Available |
Source: Public Records
Mortgage History
| Date | Status | Borrower | Loan Amount |
|---|---|---|---|
| Closed | Calderon Matthew | $410,000 | |
| Closed | Calderon Matthew | $424,297 |
Source: Public Records
Tax History Compared to Growth
Tax History
| Year | Tax Paid | Tax Assessment Tax Assessment Total Assessment is a certain percentage of the fair market value that is determined by local assessors to be the total taxable value of land and additions on the property. | Land | Improvement |
|---|---|---|---|---|
| 2025 | $5,775 | $427,945 | $25,704 | $402,241 |
| 2024 | $5,775 | $419,554 | $25,200 | $394,354 |
| 2023 | $5,666 | $411,328 | $24,706 | $386,622 |
| 2022 | $5,511 | $403,264 | $24,222 | $379,042 |
| 2021 | $5,372 | $395,358 | $23,748 | $371,610 |
| 2019 | $5,416 | $383,634 | $23,045 | $360,589 |
| 2018 | $5,017 | $376,113 | $22,594 | $353,519 |
| 2016 | $7,465 | $361,510 | $21,717 | $339,793 |
| 2015 | $4,214 | $356,080 | $21,391 | $334,689 |
| 2014 | $4,318 | $349,105 | $20,972 | $328,133 |
Source: Public Records
Map
Nearby Homes
- 6142 Oliva Ave
- 6062 Pimenta Ave
- 6034 Pepperwood Ave
- 17820 Lakewood Blvd Unit 30
- 17820 Lakewood Blvd Unit 3
- 9112 Cedar St
- 3711 E Hedda St
- 6107 Faculty Ave
- 5944 Blackthorne Ave
- 4342 Arabella St
- 3806 E Arabella St
- 9253 Rose St
- 17441 Virginia Ave Unit E
- 4814 Hedda St
- 6324 Johnson Ave
- 6023 Whitewood Ave
- 9133 Ramona St Unit 2
- 17458 Deerfield Ave
- 8723 Artesia Blvd Unit 68
- 5839 Faculty Ave
- 6153 Pimenta Ave
- 6162 Oliva Ave
- 6156 Oliva Ave
- 4117 Ashworth St
- 4113 Ashworth St
- 6152 Oliva Ave
- 6147 Pimenta Ave
- 6162 Pimenta Ave
- 4107 Ashworth St
- 6156 Pimenta Ave
- 6146 Oliva Ave
- 6152 Pimenta Ave
- 6143 Pimenta Ave
- 4123 Ashworth St
- 6146 Pimenta Ave
- 4207 Ashworth St
- 4203 Ashworth St
- 4103 Ashworth St
- 4025 Ashworth St
- 6137 Pimenta Ave