6164 W Fork Rd Cincinnati, OH 45247
Estimated Value: $383,000 - $465,000
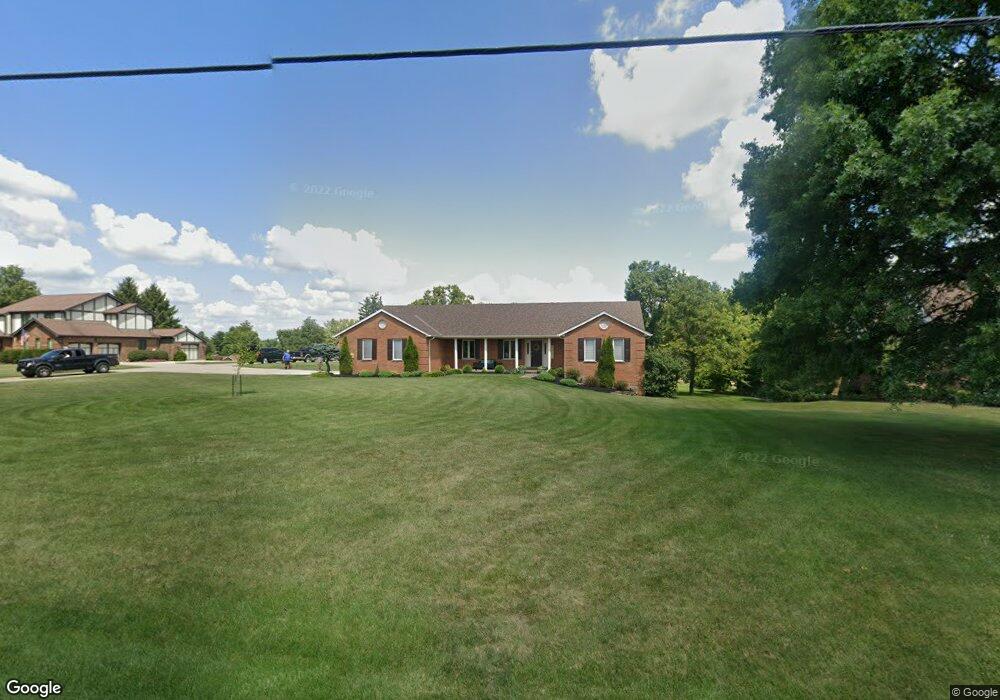
About This Home
This home is located at 6164 W Fork Rd, Cincinnati, OH 45247 and is currently estimated at $427,402, approximately $197 per square foot. 6164 W Fork Rd is a home located in Hamilton County with nearby schools including Monfort Heights Elementary School, White Oak Middle School, and Colerain High School.
Ownership History
We collect this data history from publicly available records. To have your information removed, we recommend requesting removal directly through your county’s website.
Purchase Details
Purchase Details
Home Financials for this Owner
Home Financials are based on the most recent Mortgage that was taken out on this home.Home Values in the Area
Average Home Value in this Area
Purchase History
We collect this data history from publicly available records. To have your information removed, we recommend requesting removal directly through your county’s website.
| Date | Buyer | Sale Price | Title Company |
|---|---|---|---|
| $160,000 | Attorney | ||
| -- | -- |
Mortgage History
We collect this data history from publicly available records. To have your information removed, we recommend requesting removal directly through your county’s website.
| Date | Status | Borrower | Loan Amount |
|---|---|---|---|
| Previous Owner | $163,000 |
Tax History
We collect this data history from publicly available records. To have your information removed, we recommend requesting removal directly through your county’s website.
| Year | Tax Paid | Tax Assessment Tax Assessment Total Assessment is a certain percentage of the fair market value that is determined by local assessors to be the total taxable value of land and additions on the property. | Land | Improvement |
|---|---|---|---|---|
| 2025 | $7,626 | $137,358 | $16,800 | $120,558 |
| 2023 | $7,546 | $137,358 | $16,800 | $120,558 |
| 2022 | $6,077 | $90,556 | $17,640 | $72,916 |
| 2021 | $5,687 | $90,556 | $17,640 | $72,916 |
| 2020 | $5,616 | $90,556 | $17,640 | $72,916 |
| 2019 | $5,927 | $86,244 | $16,800 | $69,444 |
| 2018 | $5,295 | $86,244 | $16,800 | $69,444 |
| 2017 | $5,074 | $86,244 | $16,800 | $69,444 |
| 2016 | $4,920 | $81,484 | $16,632 | $64,852 |
| 2015 | $4,897 | $81,484 | $16,632 | $64,852 |
| 2014 | $4,913 | $81,484 | $16,632 | $64,852 |
| 2013 | $4,716 | $82,306 | $16,800 | $65,506 |
Map
- 6183 W Fork Rd
- Site 1 Brierly Creek Rd
- 5807 Gaines Rd
- 5792 Gaines Rd
- 6048 Eden Place Dr
- 5444 Bluesky Dr
- 5713 Sheed Rd
- 6205 Blue Lake Dr Unit 3A
- 5804 Cedaridge Dr
- 5265 Eaglesnest Dr
- 6586 Hearne Rd Unit 2T
- 5563 Haft Rd
- 5203 S Eaglesnest Dr
- 7098 Sheed Rd
- 5588 W Fork Rd
- 6643 Hearne Rd
- 6617 Hearne Rd
- 6646 Hearne Rd
- 6611 Hearne Rd
- 5310 Rybolt Rd
Ask me questions while you tour the home.