Estimated Value: $208,000 - $268,000
3
Beds
3
Baths
2,334
Sq Ft
$102/Sq Ft
Est. Value
About This Home
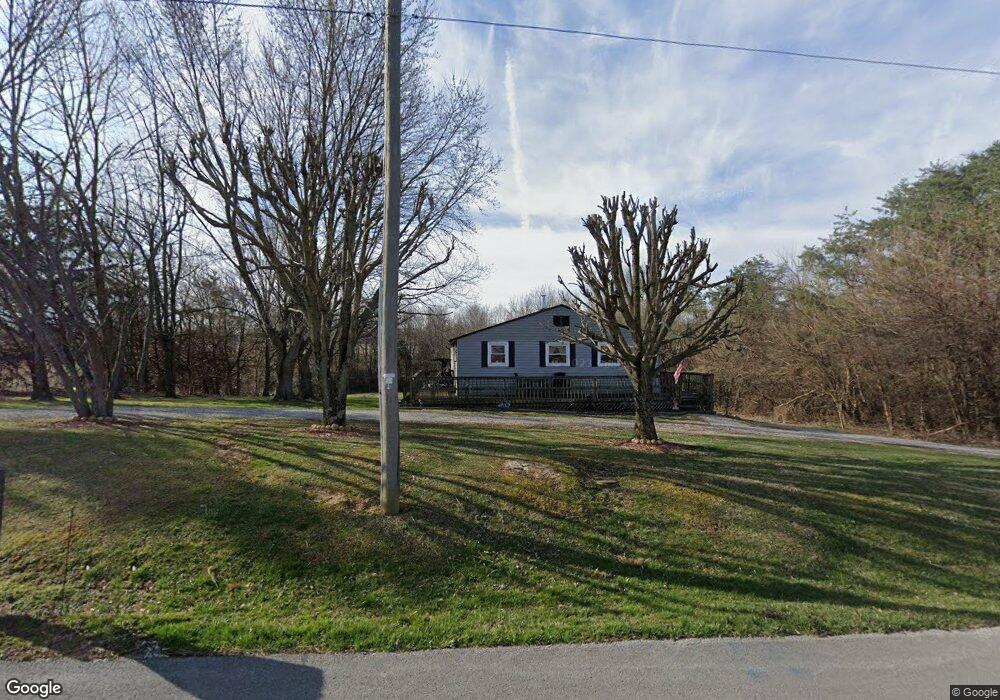
This home is located at 6165 E Olive Branch Rd, Pekin, IN 47165 and is currently estimated at $238,787, approximately $102 per square foot. 6165 E Olive Branch Rd is a home located in Washington County with nearby schools including East Washington Elementary School, East Washington Middle School, and Eastern High School.
Ownership History
Date
Name
Owned For
Owner Type
Purchase Details
Closed on
Nov 20, 2017
Sold by
Peachy Titus
Bought by
Compton Charles A
Current Estimated Value
Home Financials for this Owner
Home Financials are based on the most recent Mortgage that was taken out on this home.
Original Mortgage
$98,188
Outstanding Balance
$84,154
Interest Rate
4.75%
Mortgage Type
FHA
Estimated Equity
$154,633
Purchase Details
Closed on
Sep 17, 2015
Sold by
Tennyson Scott and Wells Fargo Bank Na
Bought by
Peachey Titus
Purchase Details
Closed on
Mar 8, 2011
Sold by
Wells Fargo Financial Indiana Inc
Bought by
Tennyson Scott
Home Financials for this Owner
Home Financials are based on the most recent Mortgage that was taken out on this home.
Original Mortgage
$60,818
Interest Rate
5.25%
Mortgage Type
FHA
Purchase Details
Closed on
Dec 3, 2010
Sold by
Odonnell Charles and Odonnell Traci
Bought by
Wells Fargo Financial Indiana Inc
Create a Home Valuation Report for This Property
The Home Valuation Report is an in-depth analysis detailing your home's value as well as a comparison with similar homes in the area
Home Values in the Area
Average Home Value in this Area
Purchase History
| Date | Buyer | Sale Price | Title Company |
|---|---|---|---|
| Compton Charles A | $100,000 | Kemp Title Agency, Llc | |
| Peachey Titus | $30,300 | None Available | |
| Tennyson Scott | -- | None Available | |
| Wells Fargo Financial Indiana Inc | -- | None Available |
Source: Public Records
Mortgage History
| Date | Status | Borrower | Loan Amount |
|---|---|---|---|
| Open | Compton Charles A | $98,188 | |
| Previous Owner | Tennyson Scott | $60,818 |
Source: Public Records
Tax History Compared to Growth
Tax History
| Year | Tax Paid | Tax Assessment Tax Assessment Total Assessment is a certain percentage of the fair market value that is determined by local assessors to be the total taxable value of land and additions on the property. | Land | Improvement |
|---|---|---|---|---|
| 2024 | $1,138 | $146,800 | $26,000 | $120,800 |
| 2023 | $1,034 | $137,500 | $26,000 | $111,500 |
| 2022 | $990 | $124,900 | $26,000 | $98,900 |
| 2021 | $948 | $119,000 | $26,000 | $93,000 |
| 2020 | $906 | $115,700 | $26,000 | $89,700 |
| 2019 | $824 | $110,800 | $26,000 | $84,800 |
| 2018 | $707 | $103,400 | $26,000 | $77,400 |
| 2017 | $625 | $106,200 | $26,000 | $80,200 |
| 2016 | $1,750 | $129,300 | $26,000 | $103,300 |
| 2014 | $763 | $134,800 | $26,000 | $108,800 |
| 2013 | $716 | $132,900 | $26,000 | $106,900 |
Source: Public Records
Map
Nearby Homes
- 6183 E Motsinger Rd
- 0 S Brown Ln
- 2698 S Mount Zion Church Rd
- 4592 S Old 60
- 4592 Indiana 160
- 1188 N Renee Ct
- 2980 E Banet Rd
- 520 E Main St
- 530 E Main St
- 341 S 3rd St
- 3305 E Randy Ln
- 10097 E State Rd 160
- 8807 E Lost College Rd
- 130 E Eastern Hills Blvd
- 6872 E Hurst Rd
- off E Hurst Rd
- 0 E Hurst Rd
- E Unit WP001
- 3250 S Wathen Rd
- 0 State Road 135 West Side Rd Unit 2025011759
- 6165 E Olive Branch Rd
- 6335 E Olive Branch Rd
- 5804 E Farabee Rd
- 6713 E Olive Branch Rd
- 6303 E Farabee Rd
- 6635 E Olive Branch Rd
- 5771 E Farabee Rd
- 6719 E Olive Branch Rd
- 6721 E Olive Branch Rd
- 6642 E Olive Branch Rd
- 6755 E Olive Branch Rd
- 6771 E Olive Branch Rd
- 5770 E Farabee Rd
- 3411 S Eastern School Rd
- 3438 S Eastern School Rd
- 6498 E Farabee Rd
- 6555 E Motsinger Rd
- 6857 E Olive Branch Rd
- 3512 S Eastern School Rd
- 6925 E Olive Branch Rd