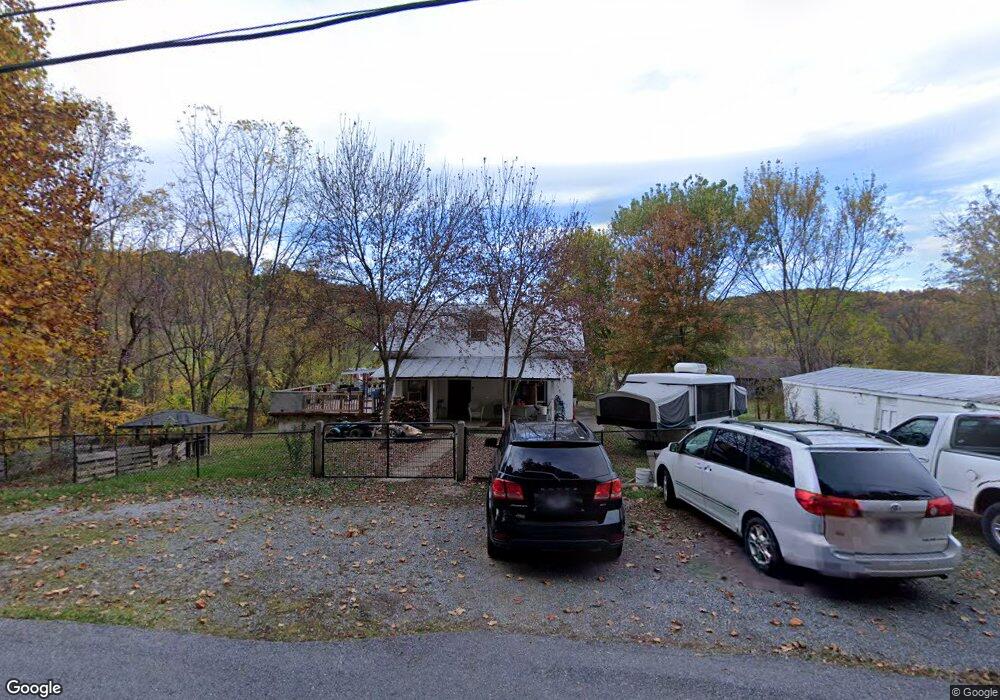
6165 Jearoldstown Rd Fall Branch, TN 37656
Estimated Value: $219,000 - $265,462
3
Beds
1
Bath
2,072
Sq Ft
$113/Sq Ft
Est. Value
About This Home
This home is located at 6165 Jearoldstown Rd, Fall Branch, TN 37656 and is currently estimated at $234,366, approximately $113 per square foot. 6165 Jearoldstown Rd is a home located in Greene County with nearby schools including Baileyton Elementary School, North Greene Middle School, and North Greene High School.
Ownership History
Date
Name
Owned For
Owner Type
Purchase Details
Closed on
Nov 1, 2016
Sold by
Jones Viveca A
Bought by
Marosites Richard W and Marosites Heather M
Current Estimated Value
Home Financials for this Owner
Home Financials are based on the most recent Mortgage that was taken out on this home.
Original Mortgage
$75,288
Interest Rate
3.43%
Mortgage Type
New Conventional
Purchase Details
Closed on
Sep 20, 2006
Sold by
Griffin Denise
Bought by
Federal Home Loan Mortgage Corporation
Purchase Details
Closed on
Jul 28, 2006
Sold by
Griffin Denise
Bought by
Federal Home Loan Mortgage Corporation
Purchase Details
Closed on
Jun 15, 2006
Purchase Details
Closed on
May 17, 2006
Sold by
Griffin Denise
Bought by
Federal Home Loan Mortgage Corporation
Purchase Details
Closed on
May 26, 1998
Sold by
Barnett Karen Gail
Bought by
Compton Lisa
Purchase Details
Closed on
Sep 8, 1992
Bought by
Barnett Karen Gail
Create a Home Valuation Report for This Property
The Home Valuation Report is an in-depth analysis detailing your home's value as well as a comparison with similar homes in the area
Home Values in the Area
Average Home Value in this Area
Purchase History
| Date | Buyer | Sale Price | Title Company |
|---|---|---|---|
| Marosites Richard W | $85,000 | -- | |
| Federal Home Loan Mortgage Corporation | -- | -- | |
| Federal Home Loan Mortgage Corporation | -- | -- | |
| -- | $85,000 | -- | |
| Federal Home Loan Mortgage Corporation | -- | -- | |
| Compton Lisa | $70,000 | -- | |
| Barnett Karen Gail | $20,000 | -- |
Source: Public Records
Mortgage History
| Date | Status | Borrower | Loan Amount |
|---|---|---|---|
| Open | Barnett Karen Gail | $75,288 | |
| Closed | Marosites Richard W | $75,288 |
Source: Public Records
Tax History Compared to Growth
Tax History
| Year | Tax Paid | Tax Assessment Tax Assessment Total Assessment is a certain percentage of the fair market value that is determined by local assessors to be the total taxable value of land and additions on the property. | Land | Improvement |
|---|---|---|---|---|
| 2024 | $722 | $43,775 | $11,225 | $32,550 |
| 2023 | $722 | $43,775 | $0 | $0 |
| 2022 | $40,600 | $20,175 | $6,925 | $13,250 |
| 2021 | $406 | $20,175 | $6,925 | $13,250 |
| 2020 | $406 | $20,175 | $6,925 | $13,250 |
| 2019 | $406 | $20,175 | $6,925 | $13,250 |
| 2018 | $406 | $20,175 | $6,925 | $13,250 |
| 2017 | $356 | $18,025 | $6,975 | $11,050 |
| 2016 | $338 | $18,025 | $6,975 | $11,050 |
| 2015 | $338 | $18,025 | $6,975 | $11,050 |
| 2014 | $338 | $18,025 | $6,975 | $11,050 |
Source: Public Records
Map
Nearby Homes
- Tr 1 Joe R McCrary Rd
- 106 Davis Rd
- 255 Bank Dr
- 40 Spring Ln
- 1415 Highway 93
- 1340 Ryan Rd
- 0 Tbd Highway 93 Unit LotWO001
- 1625 Highway 93
- 88/Ac Tbd Hwy 93
- 480 Fordtown Rd
- 160 Forrest Rd
- 545 Fordtown Rd
- 263 Moulton Rd
- 18525 Horton Hwy
- 505 Jackson Rd
- 180 Kincheloe Rd
- 2145 Tennessee 93
- 176 Moulton Rd
- Tbd Oak Glen Cir
- 3016 Highway 81
- 0 Jearoldstown Rd
- 0 Jearoldstown Rd Unit 24045882
- 0 Jearoldstown Rd Unit 24045881
- 0 Jearoldstown Rd Unit 24045879
- 0 Jearoldstown Rd Unit 3 11529693
- 0 Jearoldstown Rd Unit 2 11529685
- 0 Jearoldstown Rd Unit Lot 1 11529644
- 310 Jeroldstown Rd
- TBD Gray Sta-Sul Springs Rd
- 3219 North
- 3213 North
- 3223 North
- 296 Jearoldstown Rd
- 6135 Jearoldstown Rd
- 6135 Jearoldstown Rd
- 295 Jearoldstown Rd
- 268 Jeroldstown Rd
- 0 Tucker Hollow Rd W
- TBD Tucker Hollow Rd W
- 124 Tucker Hollow Rd