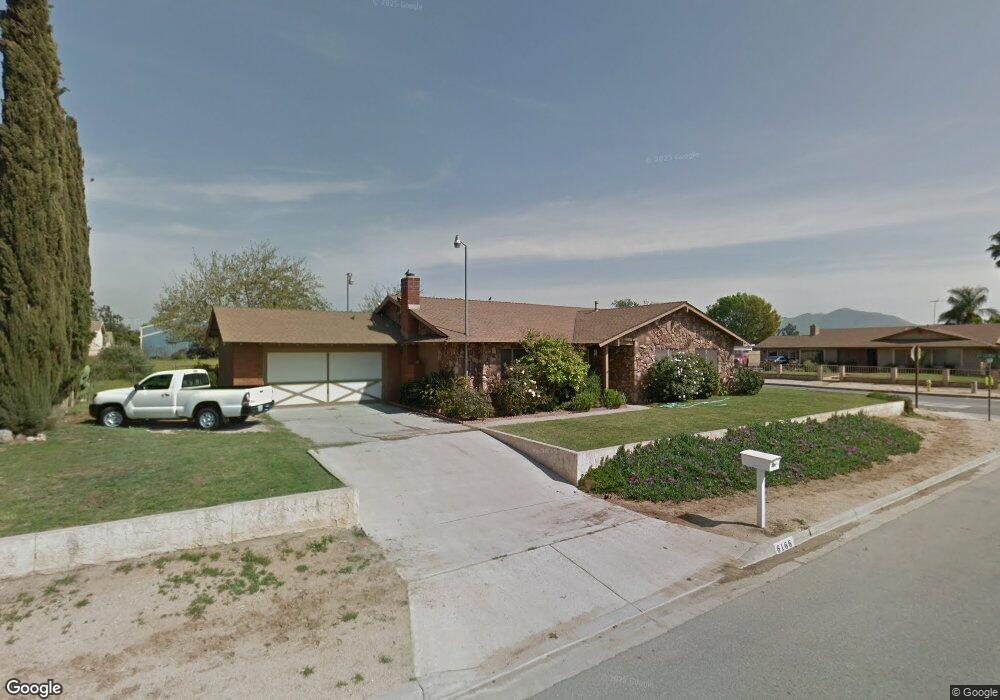
6166 Lucretia Ave Mira Loma, CA 91752
Estimated Value: $745,153 - $849,000
4
Beds
2
Baths
1,749
Sq Ft
$458/Sq Ft
Est. Value
About This Home
This home is located at 6166 Lucretia Ave, Mira Loma, CA 91752 and is currently estimated at $801,788, approximately $458 per square foot. 6166 Lucretia Ave is a home located in Riverside County with nearby schools including Sky Country Elementary School, Mira Loma Middle School, and Jurupa Valley High School.
Ownership History
Date
Name
Owned For
Owner Type
Purchase Details
Closed on
Oct 30, 1996
Sold by
Thornburg Bobby L and Thornburg Johnson F
Bought by
Robb Richard O and Robb Debra E
Current Estimated Value
Home Financials for this Owner
Home Financials are based on the most recent Mortgage that was taken out on this home.
Original Mortgage
$144,676
Outstanding Balance
$14,032
Interest Rate
7.91%
Mortgage Type
FHA
Estimated Equity
$787,756
Purchase Details
Closed on
May 8, 1995
Sold by
Thornburg Daura Ann
Bought by
Thornburg Bobby Leroy
Home Financials for this Owner
Home Financials are based on the most recent Mortgage that was taken out on this home.
Original Mortgage
$133,393
Interest Rate
8.47%
Mortgage Type
FHA
Purchase Details
Closed on
Apr 17, 1995
Sold by
Ray Mary Ellen
Bought by
Thornburg Bobby Leroy and Johnson David F
Home Financials for this Owner
Home Financials are based on the most recent Mortgage that was taken out on this home.
Original Mortgage
$133,393
Interest Rate
8.47%
Mortgage Type
FHA
Create a Home Valuation Report for This Property
The Home Valuation Report is an in-depth analysis detailing your home's value as well as a comparison with similar homes in the area
Home Values in the Area
Average Home Value in this Area
Purchase History
| Date | Buyer | Sale Price | Title Company |
|---|---|---|---|
| Robb Richard O | $147,000 | First American Title Ins Co | |
| Thornburg Bobby Leroy | -- | Stewart Title Co | |
| Thornburg Bobby Leroy | $135,000 | Stewart Title Co |
Source: Public Records
Mortgage History
| Date | Status | Borrower | Loan Amount |
|---|---|---|---|
| Open | Robb Richard O | $144,676 | |
| Previous Owner | Thornburg Bobby Leroy | $133,393 |
Source: Public Records
Tax History Compared to Growth
Tax History
| Year | Tax Paid | Tax Assessment Tax Assessment Total Assessment is a certain percentage of the fair market value that is determined by local assessors to be the total taxable value of land and additions on the property. | Land | Improvement |
|---|---|---|---|---|
| 2025 | $2,561 | $239,378 | $81,416 | $157,962 |
| 2023 | $2,561 | $230,084 | $78,255 | $151,829 |
| 2022 | $2,513 | $225,573 | $76,721 | $148,852 |
| 2021 | $2,494 | $221,151 | $75,217 | $145,934 |
| 2020 | $2,471 | $218,884 | $74,446 | $144,438 |
| 2019 | $2,421 | $214,593 | $72,987 | $141,606 |
| 2018 | $2,343 | $210,386 | $71,556 | $138,830 |
| 2017 | $2,318 | $206,261 | $70,153 | $136,108 |
| 2016 | $2,285 | $202,218 | $68,778 | $133,440 |
| 2015 | $2,253 | $199,183 | $67,746 | $131,437 |
| 2014 | $2,101 | $195,283 | $66,420 | $128,863 |
Source: Public Records
Map
Nearby Homes
- 6323 Smith Ave
- 11686 Del Sur Dr
- 0 Holmes Ave Unit IG25238110
- 5853 Aurora Ave
- 11187 58th St
- 11915 Berlyn Dove Ct
- 6415 Etiwanda Ave
- 11913 Solitaire Ct
- 11958 Sunstone Ct
- 5685 Ptolemy Way
- 5621 Avocet Dr
- 5594 Skimmer Dr
- 5599 Skimmer Dr
- 6093 Troth St
- 11877 Crossbill Way
- 0 Etiwanda Ave & 54th St Unit DW25195682
- 5344 Lucretia Ave
- 5286 Trail Canyon Dr
- 11923 Meander Way
- 11101 Gemini Ct
- 6146 Lucretia Ave
- 6133 Jupiter Dr
- 6120 Lucretia Ave
- 11392 Sky Country Dr
- 11378 Sky Country Dr
- 6121 Jupiter Dr
- 6173 Lucretia Ave
- 6149 Lucretia Ave
- 11364 Sky Country Dr
- 6109 Jupiter Dr
- 6187 Lucretia Ave
- 6121 Lucretia Ave
- 6100 Lucretia Ave
- 11350 Sky Country Dr
- 6107 Lucretia Ave
- 6199 Lucretia Ave
- 6097 Jupiter Dr
- 6090 Lucretia Ave
- 11336 Sky Country Dr
- 11329 Sky Country Dr