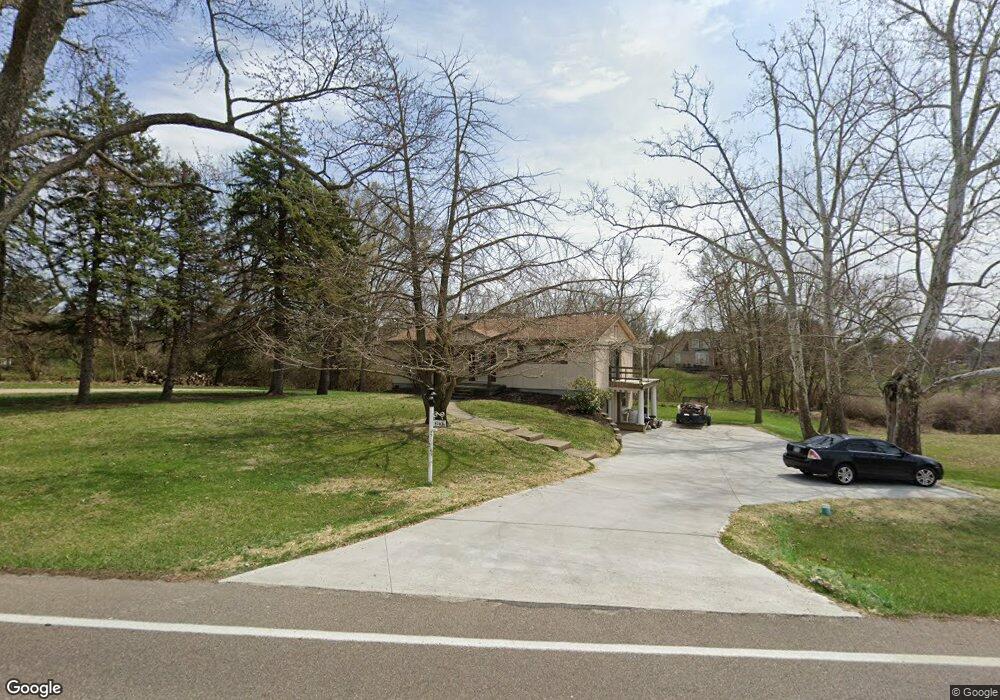
6169 Rapid Run Rd Cincinnati, OH 45233
Cotillion Village NeighborhoodEstimated Value: $151,000 - $266,000
2
Beds
2
Baths
1,215
Sq Ft
$179/Sq Ft
Est. Value
About This Home
This home is located at 6169 Rapid Run Rd, Cincinnati, OH 45233 and is currently estimated at $217,630, approximately $179 per square foot. 6169 Rapid Run Rd is a home located in Hamilton County with nearby schools including John Foster Dulles Elementary School, Rapid Run Middle School, and Oak Hills High School.
Ownership History
Date
Name
Owned For
Owner Type
Purchase Details
Closed on
Mar 10, 2022
Sold by
Theders Daniel G
Bought by
Theders Daniel G and Asman Monica A
Current Estimated Value
Home Financials for this Owner
Home Financials are based on the most recent Mortgage that was taken out on this home.
Original Mortgage
$150,350
Outstanding Balance
$139,184
Interest Rate
3.76%
Mortgage Type
New Conventional
Estimated Equity
$78,446
Purchase Details
Closed on
Mar 3, 2022
Sold by
Unknown
Bought by
Theders Daniel G
Home Financials for this Owner
Home Financials are based on the most recent Mortgage that was taken out on this home.
Original Mortgage
$150,350
Outstanding Balance
$139,184
Interest Rate
3.76%
Mortgage Type
New Conventional
Estimated Equity
$78,446
Purchase Details
Closed on
Dec 28, 2005
Sold by
Asman Coralee M
Bought by
Asman Jeffrey
Home Financials for this Owner
Home Financials are based on the most recent Mortgage that was taken out on this home.
Original Mortgage
$116,050
Interest Rate
5.87%
Mortgage Type
Fannie Mae Freddie Mac
Purchase Details
Closed on
May 25, 2004
Sold by
Mccarthy Monetta E and Mccarthy William L
Bought by
Asman Harold and Asman Coralee M
Purchase Details
Closed on
Mar 21, 2000
Sold by
Phillips James V and Phillips Corena
Bought by
Mccarthy William L and Mccarthy Monetta E
Create a Home Valuation Report for This Property
The Home Valuation Report is an in-depth analysis detailing your home's value as well as a comparison with similar homes in the area
Home Values in the Area
Average Home Value in this Area
Purchase History
| Date | Buyer | Sale Price | Title Company |
|---|---|---|---|
| Theders Daniel G | $319,202 | Yonas & Phillabaum Llc | |
| Theders Daniel G | $155,000 | Yonas John J | |
| Asman Jeffrey | -- | Advanced Land Title Agency | |
| Asman Harold | $145,000 | -- | |
| Mccarthy William L | -- | -- |
Source: Public Records
Mortgage History
| Date | Status | Borrower | Loan Amount |
|---|---|---|---|
| Open | Theders Daniel G | $150,350 | |
| Previous Owner | Asman Jeffrey | $116,050 |
Source: Public Records
Tax History
| Year | Tax Paid | Tax Assessment Tax Assessment Total Assessment is a certain percentage of the fair market value that is determined by local assessors to be the total taxable value of land and additions on the property. | Land | Improvement |
|---|---|---|---|---|
| 2025 | $4,220 | $54,251 | $28,340 | $25,911 |
| 2024 | $4,141 | $54,251 | $28,340 | $25,911 |
| 2023 | $4,151 | $54,251 | $28,340 | $25,911 |
| 2022 | $4,502 | $53,662 | $28,588 | $25,074 |
| 2021 | $4,430 | $53,662 | $28,588 | $25,074 |
| 2020 | $4,479 | $53,662 | $28,588 | $25,074 |
| 2019 | $4,336 | $46,260 | $24,644 | $21,616 |
| 2018 | $4,340 | $46,260 | $24,644 | $21,616 |
| 2017 | $4,014 | $46,260 | $24,644 | $21,616 |
| 2016 | $3,911 | $44,744 | $22,512 | $22,232 |
| 2015 | $3,914 | $44,744 | $22,512 | $22,232 |
| 2014 | $2,927 | $44,744 | $22,512 | $22,232 |
| 2013 | $3,128 | $50,845 | $25,582 | $25,263 |
Source: Public Records
Map
Nearby Homes
- 6278 Gardenlake Ct
- 1287 Heather Ridge
- 1259 Wexford Ln
- 6009 Cleves Warsaw Pike
- 5949 Cleves Warsaw Pike
- 1659 Devils Backbone Rd
- 1711 Ebenezer Rd
- 5789 Juvene Way
- 835 Neeb Rd
- 712 Libbejo Dr
- 665 Fox Trails Way
- 5773 Fourson Dr
- 625 Conina Dr
- 571 Libbejo Dr
- 1006 Pineknot Dr
- 5320 Hillside Ave
- 5318 Hillside Ave
- 5466 Gwendolyn Ridge
- 5671 Julmar Dr
- 5496 Gwendolyn Ridge
- 6161 Rapid Run Rd
- 6184 Rapid Run Rd
- 6174 Rapid Run Rd
- 6165 Rapid Run Rd
- 6163 Rapid Run Rd
- 6162 Rapid Run Rd
- 6194 Rapid Run Rd
- 6168 Rapid Run Rd
- 959 Arborrun Dr
- 981 Arborrun Dr
- 6208 Rapid Run Rd
- 947 Arborrun Dr
- 6160 Rapid Run Rd
- 6160 Rapid Run Rd Unit 2
- 6217 Rapid Run Rd
- 931 Arborrun Dr
- 6152 Rapid Run Rd
- 919 Arborrun Dr
- 6172 Cedarbluff Ct
- 6164 Cedarbluff Ct
Your Personal Tour Guide
Ask me questions while you tour the home.