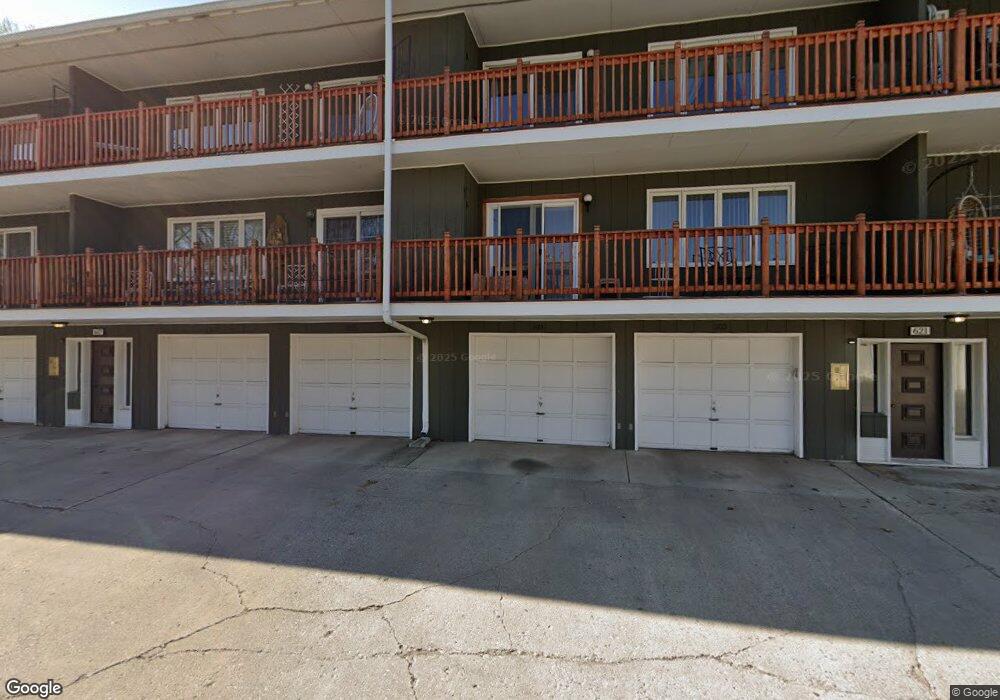
617 7th St S Unit 101 Fargo, ND 58103
Hawthorne NeighborhoodEstimated Value: $148,000 - $182,390
2
Beds
2
Baths
1,176
Sq Ft
$143/Sq Ft
Est. Value
About This Home
This home is located at 617 7th St S Unit 101, Fargo, ND 58103 and is currently estimated at $168,098, approximately $142 per square foot. 617 7th St S Unit 101 is a home located in Cass County with nearby schools including Clara Barton Elementary School, Ben Franklin Middle School, and South High School.
Ownership History
Date
Name
Owned For
Owner Type
Purchase Details
Closed on
Sep 3, 2008
Sold by
Stremick Ricky J
Bought by
Kotta Jonathan P
Current Estimated Value
Home Financials for this Owner
Home Financials are based on the most recent Mortgage that was taken out on this home.
Original Mortgage
$77,000
Outstanding Balance
$51,558
Interest Rate
6.66%
Mortgage Type
New Conventional
Estimated Equity
$116,540
Purchase Details
Closed on
Aug 12, 2007
Sold by
Rjs Building Systems Inc
Bought by
Stremick Ricky J
Home Financials for this Owner
Home Financials are based on the most recent Mortgage that was taken out on this home.
Original Mortgage
$90,000
Interest Rate
6.77%
Mortgage Type
Purchase Money Mortgage
Purchase Details
Closed on
Sep 1, 2005
Sold by
Alice C Serkland Trust
Bought by
Delaney Michael J
Home Financials for this Owner
Home Financials are based on the most recent Mortgage that was taken out on this home.
Original Mortgage
$76,000
Interest Rate
5.93%
Mortgage Type
New Conventional
Create a Home Valuation Report for This Property
The Home Valuation Report is an in-depth analysis detailing your home's value as well as a comparison with similar homes in the area
Home Values in the Area
Average Home Value in this Area
Purchase History
| Date | Buyer | Sale Price | Title Company |
|---|---|---|---|
| Kotta Jonathan P | -- | -- | |
| Stremick Ricky J | -- | -- | |
| Delaney Michael J | -- | -- |
Source: Public Records
Mortgage History
| Date | Status | Borrower | Loan Amount |
|---|---|---|---|
| Open | Kotta Jonathan P | $77,000 | |
| Previous Owner | Stremick Ricky J | $90,000 | |
| Previous Owner | Delaney Michael J | $76,000 |
Source: Public Records
Tax History Compared to Growth
Tax History
| Year | Tax Paid | Tax Assessment Tax Assessment Total Assessment is a certain percentage of the fair market value that is determined by local assessors to be the total taxable value of land and additions on the property. | Land | Improvement |
|---|---|---|---|---|
| 2024 | $1,570 | $73,050 | $5,400 | $67,650 |
| 2023 | $1,985 | $70,250 | $5,400 | $64,850 |
| 2022 | $1,908 | $66,250 | $5,400 | $60,850 |
| 2021 | $1,686 | $59,150 | $5,400 | $53,750 |
| 2020 | $1,668 | $59,150 | $5,400 | $53,750 |
| 2019 | $1,380 | $49,000 | $2,200 | $46,800 |
| 2018 | $1,363 | $49,000 | $2,200 | $46,800 |
| 2017 | $1,267 | $45,800 | $2,200 | $43,600 |
| 2016 | $1,135 | $44,450 | $2,200 | $42,250 |
| 2015 | $1,247 | $49,600 | $1,650 | $47,950 |
| 2014 | $1,279 | $49,600 | $1,650 | $47,950 |
| 2013 | $1,280 | $49,600 | $1,650 | $47,950 |
Source: Public Records
Map
Nearby Homes
- 605 7th St S Unit 2
- 502 8th St S Unit 5
- 502 8th St S Unit 3
- 502 8th St S Unit 1
- 502 8th St S Unit 2
- 502 8th St S Unit 4
- 505 8th St S
- 911 8th St S
- 820 10th St S Unit C20
- 601 10th St S
- 513 10th St S
- 220 8th St S Unit B2
- 220 8th St S Unit D4
- 203 8th St S
- 1020 9th Ave S
- 1118 8th Ave S
- 1124 5th Ave S
- 1024 3rd Ave S
- 344 9th Ave S
- 403 11th Ave S Unit 2
- 617 7th St S Unit 202
- 617 7th St S Unit 201
- 617 7th St S Unit 104
- 617 7th St S Unit 102
- 617 7th St S
- 621 7th St S Unit 204
- 621 7th St S Unit 203
- 621 7th St S Unit 103
- 621 7th St S
- 621 7th St S Unit 104
- 607 7th St S Unit 23
- 607 7th St S Unit 21
- 607 7th St S Unit 8
- 607 7th St S Unit 6
- 607 7th St S Unit 24
- 607 7th St S Unit 22
- 607 7th St S Unit 16
- 607 7th St S Unit 14
- 607 7th St S Unit 13
- 607 7th St S Unit 7