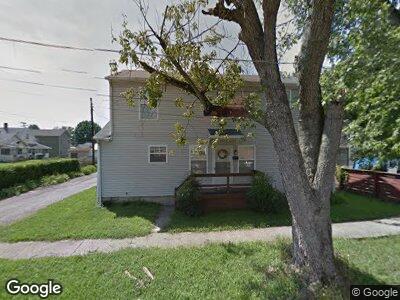
617 E 10th St New Albany, IN 47150
Estimated Value: $151,000 - $185,000
3
Beds
2
Baths
1,216
Sq Ft
$138/Sq Ft
Est. Value
About This Home
This home is located at 617 E 10th St, New Albany, IN 47150 and is currently estimated at $167,561, approximately $137 per square foot. 617 E 10th St is a home located in Floyd County with nearby schools including S. Ellen Jones Elementary School, Hazelwood Middle School, and New Albany Senior High School.
Ownership History
Date
Name
Owned For
Owner Type
Purchase Details
Closed on
Jan 26, 2021
Sold by
Spears Kelly
Bought by
Gibson Gary M
Current Estimated Value
Home Financials for this Owner
Home Financials are based on the most recent Mortgage that was taken out on this home.
Original Mortgage
$100,642
Outstanding Balance
$90,992
Interest Rate
2.67%
Mortgage Type
FHA
Estimated Equity
$71,248
Purchase Details
Closed on
Oct 23, 2006
Sold by
Sword Jason K
Bought by
Spears Kally
Home Financials for this Owner
Home Financials are based on the most recent Mortgage that was taken out on this home.
Original Mortgage
$71,872
Interest Rate
6.45%
Mortgage Type
FHA
Purchase Details
Closed on
Jul 28, 2006
Sold by
Ries Michael
Bought by
Sword Jason
Purchase Details
Closed on
Jul 5, 2006
Sold by
Lasalle Bank Na
Bought by
Sword Jason K
Purchase Details
Closed on
Aug 11, 2005
Sold by
Mcdaniel Antonio L and Mcdaniel Antonio
Bought by
Lasalle Bank Na
Create a Home Valuation Report for This Property
The Home Valuation Report is an in-depth analysis detailing your home's value as well as a comparison with similar homes in the area
Home Values in the Area
Average Home Value in this Area
Purchase History
| Date | Buyer | Sale Price | Title Company |
|---|---|---|---|
| Gibson Gary M | -- | None Available | |
| Spears Kally | -- | Real Estate Title Services | |
| Sword Jason | -- | None Available | |
| Sword Jason K | -- | Us Title | |
| Lasalle Bank Na | $76,500 | None Available |
Source: Public Records
Mortgage History
| Date | Status | Borrower | Loan Amount |
|---|---|---|---|
| Open | Gibson Gary M | $100,642 | |
| Previous Owner | Spears Kelly | $74,033 | |
| Previous Owner | Spears Kelly | $6,330 | |
| Previous Owner | Spears Kally | $71,872 |
Source: Public Records
Tax History Compared to Growth
Tax History
| Year | Tax Paid | Tax Assessment Tax Assessment Total Assessment is a certain percentage of the fair market value that is determined by local assessors to be the total taxable value of land and additions on the property. | Land | Improvement |
|---|---|---|---|---|
| 2024 | $772 | $108,400 | $10,400 | $98,000 |
| 2023 | $772 | $95,400 | $10,400 | $85,000 |
| 2022 | $827 | $96,300 | $10,400 | $85,900 |
| 2021 | $705 | $89,600 | $10,400 | $79,200 |
| 2020 | $539 | $81,300 | $10,400 | $70,900 |
| 2019 | $423 | $75,300 | $10,400 | $64,900 |
| 2018 | $451 | $77,200 | $10,400 | $66,800 |
| 2017 | $484 | $78,700 | $10,400 | $68,300 |
| 2016 | $451 | $78,800 | $10,400 | $68,400 |
| 2014 | $483 | $77,900 | $10,400 | $67,500 |
| 2013 | -- | $76,500 | $10,400 | $66,100 |
Source: Public Records
Map
Nearby Homes
- 1119 Ekin Ave
- 616 Culbertson Ave
- 1208 E Spring St
- 1318 E Spring St
- 1525 E Oak St
- 1601 Culbertson Ave
- 337 E 15th St
- 336 E 16th St
- 330 E 16th St
- 1618 Beeler St
- 1617 King St
- 1512 Locust St
- 504 E Main St
- 914 Pearl St
- 1808 E Spring St
- 1832 E Elm St
- 1906 Ekin Ave
- 158 Cherry St
- 1706 Gray Brook Ln
- 2007 Culbertson Ave
- 617 E 10th St
- 918 Culbertson Ave
- 922 Culbertson Ave
- 916 Culbertson Ave
- 601 E 10th St
- 914 Culbertson Ave
- 912 Culbertson Ave
- 907 E Oak St Unit 909
- 616 E 9th St
- 618 E 9th St
- 620 E 9th St
- 622 E 9th St
- 626 E 9th St
- 610 E 9th St Unit 612
- 628 E 9th St
- 903 E Oak St
- 1004 E Oak St
- 901 E Oak St
- 917 Culbertson Ave
- 921 Culbertson Ave