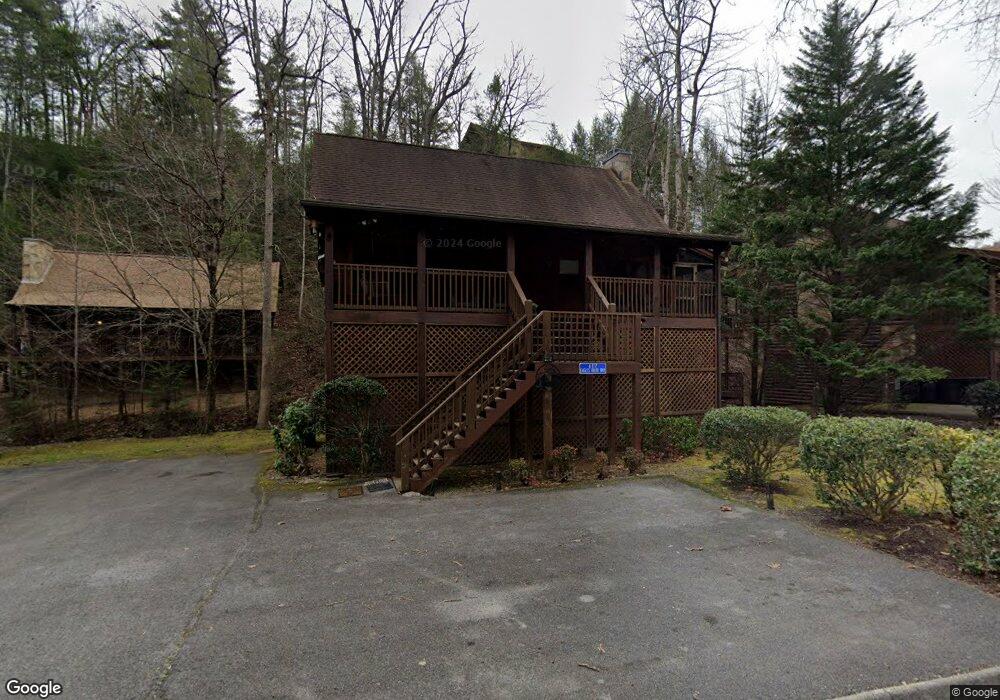
617 Eagles Blvd #255 Pigeon Forge, TN 37863
Estimated Value: $866,235
--
Bed
4
Baths
1,728
Sq Ft
$501/Sq Ft
Est. Value
About This Home
This home is located at 617 Eagles Blvd #255, Pigeon Forge, TN 37863 and is currently priced at $866,235, approximately $501 per square foot. 617 Eagles Blvd #255 is a home located in Sevier County with nearby schools including Catons Chapel Elementary School, Northview Elementary School, and Jones Cove Elementary School.
Ownership History
Date
Name
Owned For
Owner Type
Purchase Details
Closed on
Apr 19, 2021
Sold by
Sloan Jennifer S and Sloan Lee A
Bought by
Hung Amy and Hung Frank
Current Estimated Value
Home Financials for this Owner
Home Financials are based on the most recent Mortgage that was taken out on this home.
Original Mortgage
$586,000
Outstanding Balance
$529,511
Interest Rate
3.05%
Mortgage Type
New Conventional
Purchase Details
Closed on
Nov 29, 2017
Sold by
Price Jeffret A and Price Cindy L
Bought by
Sloan Jennifer S and Sloan Lee A
Home Financials for this Owner
Home Financials are based on the most recent Mortgage that was taken out on this home.
Original Mortgage
$278,900
Interest Rate
3.88%
Mortgage Type
New Conventional
Purchase Details
Closed on
Jun 9, 2005
Sold by
C & S Rentals Inc
Bought by
Price Jeffrey A
Purchase Details
Closed on
Oct 24, 2001
Sold by
Calkin Scott Partnership E
Bought by
C & S Rentals Inc
Create a Home Valuation Report for This Property
The Home Valuation Report is an in-depth analysis detailing your home's value as well as a comparison with similar homes in the area
Home Values in the Area
Average Home Value in this Area
Purchase History
| Date | Buyer | Sale Price | Title Company |
|---|---|---|---|
| Hung Amy | $732,500 | Title Co Gatlinburg | |
| Sloan Jennifer S | $309,900 | Smoky Mounatain Title | |
| Price Jeffrey A | $287,000 | -- | |
| C & S Rentals Inc | $264,900 | -- |
Source: Public Records
Mortgage History
| Date | Status | Borrower | Loan Amount |
|---|---|---|---|
| Open | Hung Amy | $586,000 | |
| Previous Owner | Sloan Jennifer S | $278,900 |
Source: Public Records
Tax History Compared to Growth
Tax History
| Year | Tax Paid | Tax Assessment Tax Assessment Total Assessment is a certain percentage of the fair market value that is determined by local assessors to be the total taxable value of land and additions on the property. | Land | Improvement |
|---|---|---|---|---|
| 2025 | $4,952 | $167,280 | $14,000 | $153,280 |
| 2024 | $4,952 | $167,280 | $14,000 | $153,280 |
| 2023 | $4,952 | $167,280 | $0 | $0 |
| 2022 | $1,720 | $104,550 | $8,750 | $95,800 |
| 2021 | $1,720 | $104,550 | $8,750 | $95,800 |
| 2020 | $1,168 | $104,550 | $8,750 | $95,800 |
| 2019 | $1,168 | $56,725 | $8,750 | $47,975 |
| 2018 | $1,168 | $56,725 | $8,750 | $47,975 |
| 2017 | $1,168 | $56,725 | $8,750 | $47,975 |
| 2016 | $1,168 | $56,725 | $8,750 | $47,975 |
| 2015 | -- | $57,850 | $0 | $0 |
| 2014 | $1,059 | $57,846 | $0 | $0 |
Source: Public Records
Map
Nearby Homes
- 570 Country Oaks Dr
- 607 Eagles Boulevard Way
- 653 Oaks View Ct
- 653 Oaks View Ct Unit Adalynns Retreat
- 727 Nighthawk Way
- 641 Kings Hills Blvd
- 664 Kings Hills Blvd
- 544 Kings Hills Blvd
- 719 Golden Eagle Way
- 735 Kings Hills Blvd
- 716 Golden Eagle Way
- 719 Kings Hills Blvd
- 749 Kings Hills Blvd
- 709 Golden Eagle Way
- 713 Harrier Court Way
- 563 Warbonnet Way
- 587 Warbonnet Way Unit 62
- 2904 Peregrine Way
- 506 Warbonnet Way
- 2915 Tipi Way
- 676 Eagles Boulevard Way
- 680 Eagles Boulevard Way
- 684 Eagles Boulevard Way
- 692 Eagles Boulevard Way
- 653 Eagles Boulevard Way
- Lot 6R-1 Country Oaks Dr
- Lot 6R-2 Country Oaks Dr
- 0 Country Oaks Dr
- 10 Country Oaks Dr
- Lots 4-9 Country Oaks Dr
- 649 Eagles Boulevard Way
- 645 Eagles Boulevard Way
- 694 Eagles Boulevard Way
- 694 Eagles Boulevard Way Unit Ofc
- 574 Country Oaks Dr
- 559 Country Oaks Dr
- 567 Country Oaks Dr
- 617 Eagles Boulevard Way
- 613 Eagles Boulevard Way
- 728 Black Hawk Way