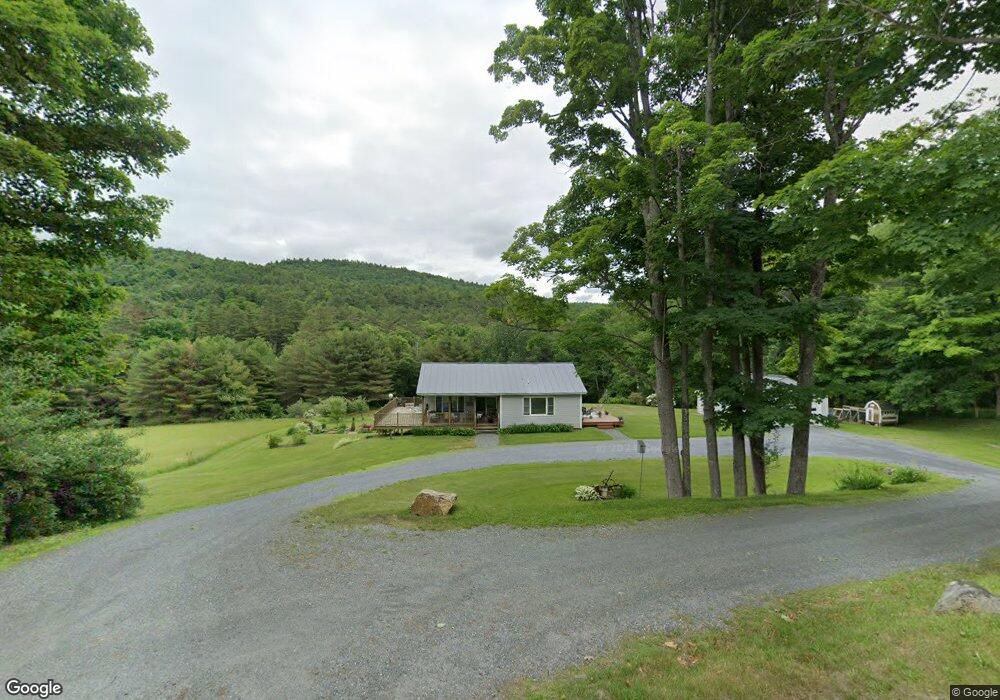
617 Elm St Claremont, NH 03743
East Claremont NeighborhoodEstimated Value: $341,000 - $392,544
1
Bed
2
Baths
1,160
Sq Ft
$310/Sq Ft
Est. Value
About This Home
This home is located at 617 Elm St, Claremont, NH 03743 and is currently estimated at $359,886, approximately $310 per square foot. 617 Elm St is a home located in Sullivan County with nearby schools including Disnard Elementary School, Claremont Middle School, and Stevens High School.
Ownership History
Date
Name
Owned For
Owner Type
Purchase Details
Closed on
Nov 13, 2017
Sold by
Thibedau Peter A
Bought by
Vigneault Daniel P and Vigneault Maryjane
Current Estimated Value
Home Financials for this Owner
Home Financials are based on the most recent Mortgage that was taken out on this home.
Original Mortgage
$128,000
Outstanding Balance
$107,201
Interest Rate
3.83%
Estimated Equity
$252,685
Purchase Details
Closed on
Nov 15, 2002
Sold by
Granger Shawny E and Granger John
Bought by
Thibedau Betty Ann and Thibedau Peter
Create a Home Valuation Report for This Property
The Home Valuation Report is an in-depth analysis detailing your home's value as well as a comparison with similar homes in the area
Home Values in the Area
Average Home Value in this Area
Purchase History
| Date | Buyer | Sale Price | Title Company |
|---|---|---|---|
| Vigneault Daniel P | $160,000 | -- | |
| Thibedau Betty Ann | $35,000 | -- |
Source: Public Records
Mortgage History
| Date | Status | Borrower | Loan Amount |
|---|---|---|---|
| Open | Vigneault Daniel P | $128,000 | |
| Previous Owner | Thibedau Betty Ann | $122,000 | |
| Previous Owner | Thibedau Betty Ann | $10,800 |
Source: Public Records
Tax History Compared to Growth
Tax History
| Year | Tax Paid | Tax Assessment Tax Assessment Total Assessment is a certain percentage of the fair market value that is determined by local assessors to be the total taxable value of land and additions on the property. | Land | Improvement |
|---|---|---|---|---|
| 2024 | $8,178 | $279,500 | $50,700 | $228,800 |
| 2023 | $7,770 | $279,500 | $50,700 | $228,800 |
| 2022 | $6,377 | $153,000 | $25,400 | $127,600 |
| 2021 | $6,270 | $153,000 | $25,400 | $127,600 |
| 2020 | $6,230 | $153,000 | $25,400 | $127,600 |
| 2019 | $6,397 | $158,900 | $25,400 | $133,500 |
| 2018 | $6,329 | $150,400 | $25,400 | $125,000 |
| 2017 | $6,416 | $150,400 | $25,400 | $125,000 |
| 2016 | $6,410 | $150,400 | $25,400 | $125,000 |
| 2015 | $6,237 | $150,400 | $25,400 | $125,000 |
| 2014 | $6,216 | $150,400 | $25,400 | $125,000 |
| 2013 | $6,525 | $180,000 | $27,000 | $153,000 |
Source: Public Records
Map
Nearby Homes
- 614 Redwater Brook Rd
- 0 Hanover St Unit 1
- 17 Alderwood Ct
- 0 Slab City Rd Unit 5036741
- 12 Emily Place
- 0 Cat Hole Rd Unit 5052634
- 48 Paddy Hollow Rd
- 4 Anderson St
- 6 Beauregard St
- 40 Citizen St
- 232 North St
- 211 North St
- 28 Tutherly Ave
- 466 Parsonage Rd
- 22 Royce St
- 38 Washington St
- 248 Main St
- 59 Lafayette St
- 8 Union St
- 58 Pearl St