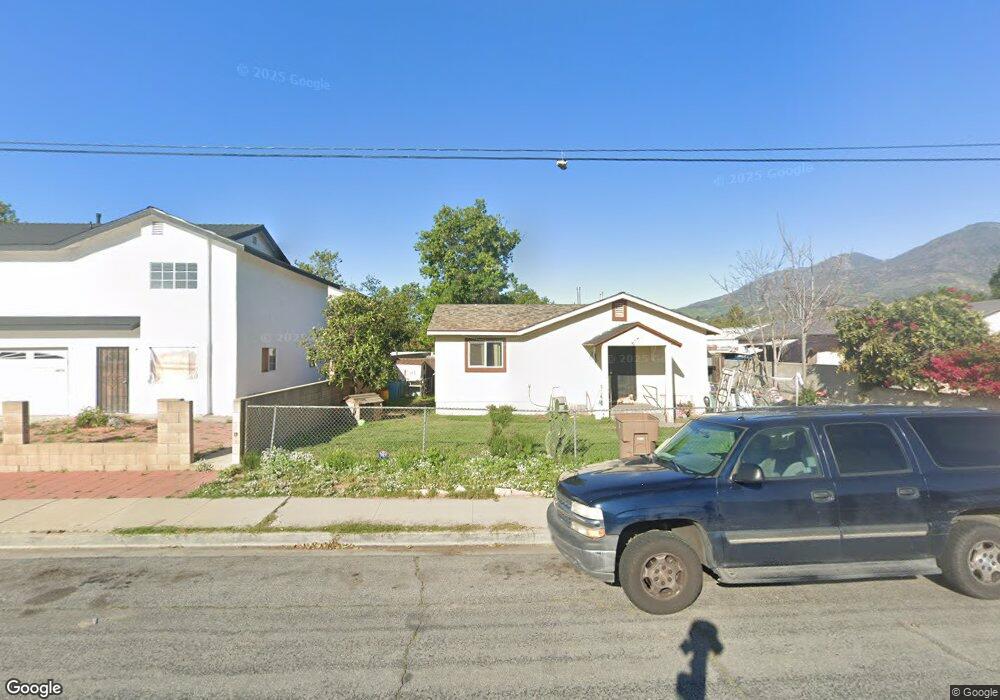
617 Lemon Way Fillmore, CA 93015
Estimated Value: $611,119 - $690,000
2
Beds
2
Baths
1,450
Sq Ft
$446/Sq Ft
Est. Value
About This Home
This home is located at 617 Lemon Way, Fillmore, CA 93015 and is currently estimated at $646,040, approximately $445 per square foot. 617 Lemon Way is a home located in Ventura County with nearby schools including Fillmore Senior High.
Ownership History
Date
Name
Owned For
Owner Type
Purchase Details
Closed on
Oct 13, 2017
Sold by
Cortez Gustavo V and Cortez Herolinda F
Bought by
Cortez Gustavo V and Cortez Herolinda F
Current Estimated Value
Purchase Details
Closed on
Jun 22, 2017
Sold by
Cortez Herolinda F and Cortez Gustavo R
Bought by
Cortez Gustavo V and Cortez Herolinda F
Purchase Details
Closed on
Aug 12, 2015
Sold by
Cortez Herolinda F and Felix Herolinda H
Bought by
Cortez Herolinda F and Cortez Gustavo
Create a Home Valuation Report for This Property
The Home Valuation Report is an in-depth analysis detailing your home's value as well as a comparison with similar homes in the area
Home Values in the Area
Average Home Value in this Area
Purchase History
| Date | Buyer | Sale Price | Title Company |
|---|---|---|---|
| Cortez Gustavo V | -- | None Available | |
| Cortez Gustavo V | -- | None Available | |
| Cortez Herolinda F | -- | None Available |
Source: Public Records
Tax History Compared to Growth
Tax History
| Year | Tax Paid | Tax Assessment Tax Assessment Total Assessment is a certain percentage of the fair market value that is determined by local assessors to be the total taxable value of land and additions on the property. | Land | Improvement |
|---|---|---|---|---|
| 2025 | $2,045 | $182,876 | $103,915 | $78,961 |
| 2024 | $2,045 | $176,898 | $101,877 | $75,021 |
| 2023 | $2,017 | $173,430 | $99,880 | $73,550 |
| 2022 | $1,869 | $170,030 | $97,922 | $72,108 |
| 2021 | $2,120 | $166,697 | $96,002 | $70,695 |
| 2020 | $1,645 | $136,817 | $95,018 | $41,799 |
| 2019 | $1,497 | $121,194 | $93,155 | $28,039 |
| 2018 | $1,468 | $118,819 | $91,329 | $27,490 |
| 2017 | $1,476 | $116,490 | $89,539 | $26,951 |
| 2016 | $2,137 | $181,518 | $136,972 | $44,546 |
| 2015 | $2,079 | $21,171 | $4,672 | $16,499 |
| 2014 | $307 | $20,759 | $4,582 | $16,177 |
Source: Public Records
Map
Nearby Homes