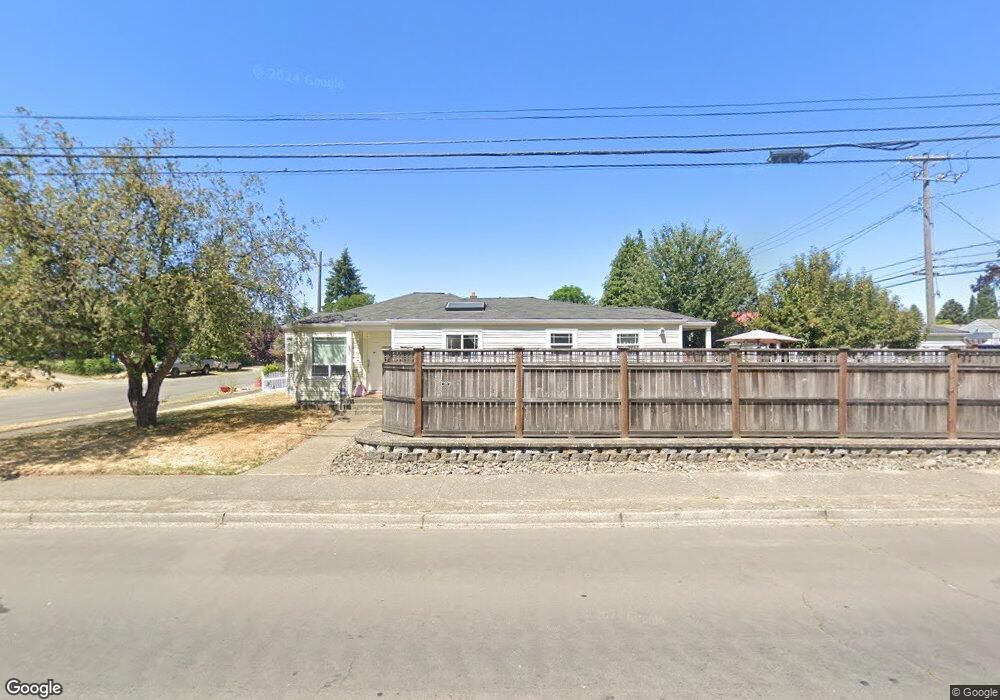
617 S 64th St Tacoma, WA 98408
South End NeighborhoodEstimated Value: $403,000 - $439,079
3
Beds
2
Baths
1,093
Sq Ft
$385/Sq Ft
Est. Value
About This Home
This home is located at 617 S 64th St, Tacoma, WA 98408 and is currently estimated at $420,520, approximately $384 per square foot. 617 S 64th St is a home located in Pierce County with nearby schools including Oakland High School, Angelo Giaudrone Middle School, and Mount Tahoma High School.
Ownership History
Date
Name
Owned For
Owner Type
Purchase Details
Closed on
Sep 18, 2016
Sold by
Bedker Phillip W and Bedker Elizabeth J
Bought by
Bedker Phillip W and Bedker Elizabeth J
Current Estimated Value
Purchase Details
Closed on
Apr 18, 2008
Sold by
Whitney Lorene J
Bought by
Bedker Phillip and Bedker Elizabeth
Purchase Details
Closed on
Aug 3, 1979
Sold by
Salles Charlotte L
Bought by
Whitney Lorene J
Create a Home Valuation Report for This Property
The Home Valuation Report is an in-depth analysis detailing your home's value as well as a comparison with similar homes in the area
Home Values in the Area
Average Home Value in this Area
Purchase History
| Date | Buyer | Sale Price | Title Company |
|---|---|---|---|
| Bedker Phillip W | -- | None Available | |
| Bedker Phillip | $115,000 | Pnwt | |
| Whitney Lorene J | $19,000 | Chicago Title Insurance Comp |
Source: Public Records
Tax History Compared to Growth
Tax History
| Year | Tax Paid | Tax Assessment Tax Assessment Total Assessment is a certain percentage of the fair market value that is determined by local assessors to be the total taxable value of land and additions on the property. | Land | Improvement |
|---|---|---|---|---|
| 2025 | $4,049 | $415,000 | $191,300 | $223,700 |
| 2024 | $4,049 | $388,800 | $184,300 | $204,500 |
| 2023 | $4,049 | $363,500 | $175,500 | $188,000 |
| 2022 | $3,796 | $390,300 | $164,500 | $225,800 |
| 2021 | $3,463 | $275,300 | $104,800 | $170,500 |
| 2019 | $2,910 | $249,600 | $86,600 | $163,000 |
| 2018 | $3,073 | $223,700 | $70,100 | $153,600 |
| 2017 | $2,750 | $194,400 | $56,300 | $138,100 |
| 2016 | $2,376 | $147,200 | $42,100 | $105,100 |
| 2014 | $1,810 | $136,600 | $39,700 | $96,900 |
| 2013 | $1,810 | $120,200 | $35,000 | $85,200 |
Source: Public Records
Map
Nearby Homes