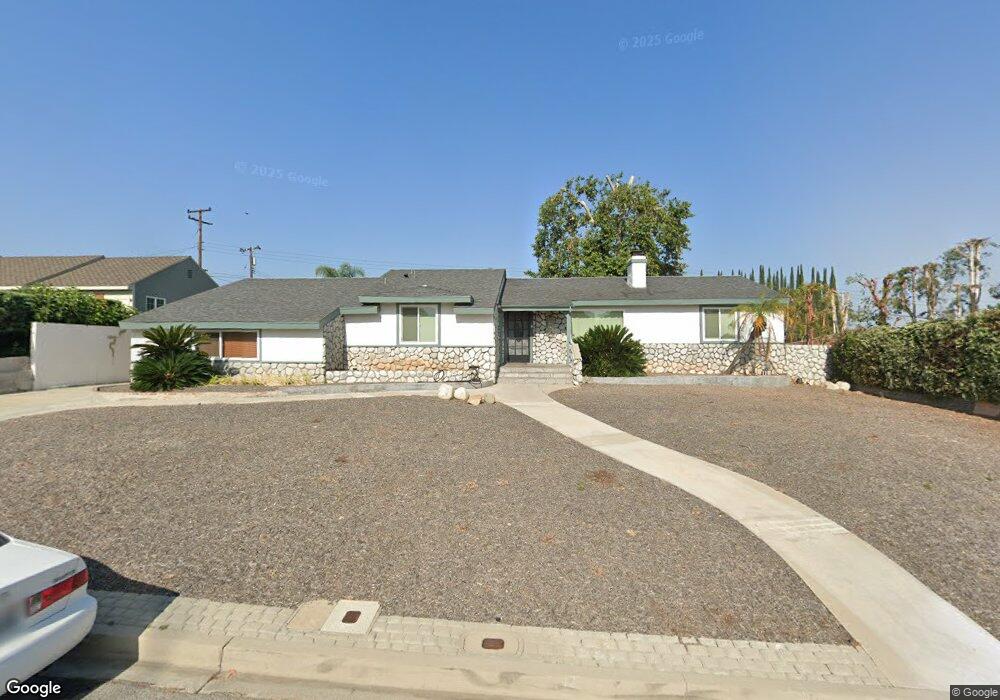
617 S Montezuma Way West Covina, CA 91791
South Hills NeighborhoodEstimated Value: $917,000 - $1,065,000
3
Beds
2
Baths
2,080
Sq Ft
$466/Sq Ft
Est. Value
About This Home
This home is located at 617 S Montezuma Way, West Covina, CA 91791 and is currently estimated at $968,750, approximately $465 per square foot. 617 S Montezuma Way is a home located in Los Angeles County with nearby schools including Mesa Elementary School, South Hills High School, and Christ Lutheran School.
Ownership History
Date
Name
Owned For
Owner Type
Purchase Details
Closed on
Jun 8, 2007
Sold by
Jenkins Frank and Jenkins Hollman F
Bought by
Jenkins Frank
Current Estimated Value
Home Financials for this Owner
Home Financials are based on the most recent Mortgage that was taken out on this home.
Original Mortgage
$114,000
Outstanding Balance
$69,832
Interest Rate
6.21%
Mortgage Type
New Conventional
Estimated Equity
$898,919
Purchase Details
Closed on
Feb 6, 1996
Sold by
Evans Linda L
Bought by
Jenkins Hollman F
Home Financials for this Owner
Home Financials are based on the most recent Mortgage that was taken out on this home.
Original Mortgage
$83,000
Interest Rate
7.04%
Purchase Details
Closed on
Dec 28, 1993
Sold by
Puccio Vincent Jimmy and Puccio Florence B
Bought by
Evans Linda L
Purchase Details
Closed on
Dec 27, 1993
Sold by
Evans Linda L
Bought by
Puccio Vincent Jimmy
Create a Home Valuation Report for This Property
The Home Valuation Report is an in-depth analysis detailing your home's value as well as a comparison with similar homes in the area
Home Values in the Area
Average Home Value in this Area
Purchase History
| Date | Buyer | Sale Price | Title Company |
|---|---|---|---|
| Jenkins Frank | -- | First American Title Ins | |
| Jenkins Hollman F | $223,000 | United Title | |
| Evans Linda L | -- | -- | |
| Puccio Vincent Jimmy | -- | -- |
Source: Public Records
Mortgage History
| Date | Status | Borrower | Loan Amount |
|---|---|---|---|
| Open | Jenkins Frank | $114,000 | |
| Closed | Jenkins Hollman F | $83,000 |
Source: Public Records
Tax History Compared to Growth
Tax History
| Year | Tax Paid | Tax Assessment Tax Assessment Total Assessment is a certain percentage of the fair market value that is determined by local assessors to be the total taxable value of land and additions on the property. | Land | Improvement |
|---|---|---|---|---|
| 2025 | $4,912 | $370,431 | $129,729 | $240,702 |
| 2024 | $4,912 | $363,169 | $127,186 | $235,983 |
| 2023 | $4,842 | $356,049 | $124,693 | $231,356 |
| 2022 | $4,778 | $349,069 | $122,249 | $226,820 |
| 2021 | $4,702 | $342,225 | $119,852 | $222,373 |
| 2019 | $4,588 | $332,077 | $116,299 | $215,778 |
| 2018 | $4,288 | $325,567 | $114,019 | $211,548 |
| 2016 | $4,029 | $312,927 | $109,593 | $203,334 |
| 2015 | $3,928 | $308,227 | $107,947 | $200,280 |
| 2014 | $3,879 | $302,190 | $105,833 | $196,357 |
Source: Public Records
Map
Nearby Homes
- 2551 E Larkwood St
- 2147 E Rio Verde Dr
- 2407 E Walnut Creek Pkwy
- 918 S Coral Tree Dr
- 2516 E Walnut Creek Pkwy
- 213 S Meadow Rd
- 631 S Hillward Ave
- 1103 Novarro St
- 1021 S Lolita St
- 920 S Spring Meadow Dr
- 910 S Donna Beth Ave
- 640 S Azusa Ave
- 512 S Barranca St
- 2828 Far View Ln
- 1777 Aspen Village Way
- 1717 Cabrillo
- 1124 S Cajon Ave
- 130 S Barranca St Unit 302
- 2829 Countrywood Ln
- 401 S Cherrywood St
- 2348 E Cortez St
- 623 S Montezuma Way
- 609 S Montezuma Way
- 2340 E Cortez St
- 616 S Montezuma Way
- 629 S Montezuma Way
- 601 S Montezuma Way
- 2345 E Larkwood St
- 622 S Montezuma Way
- 608 S Montezuma Way
- 628 S Montezuma Way
- 2339 E Larkwood St
- 600 S Montezuma Way
- 2334 E Cortez St
- 636 S Montezuma Way
- 2333 E Larkwood St
- 617 S Almirante Dr
- 623 S Almirante Dr
- 609 S Almirante Dr
- 531 S Montezuma Way