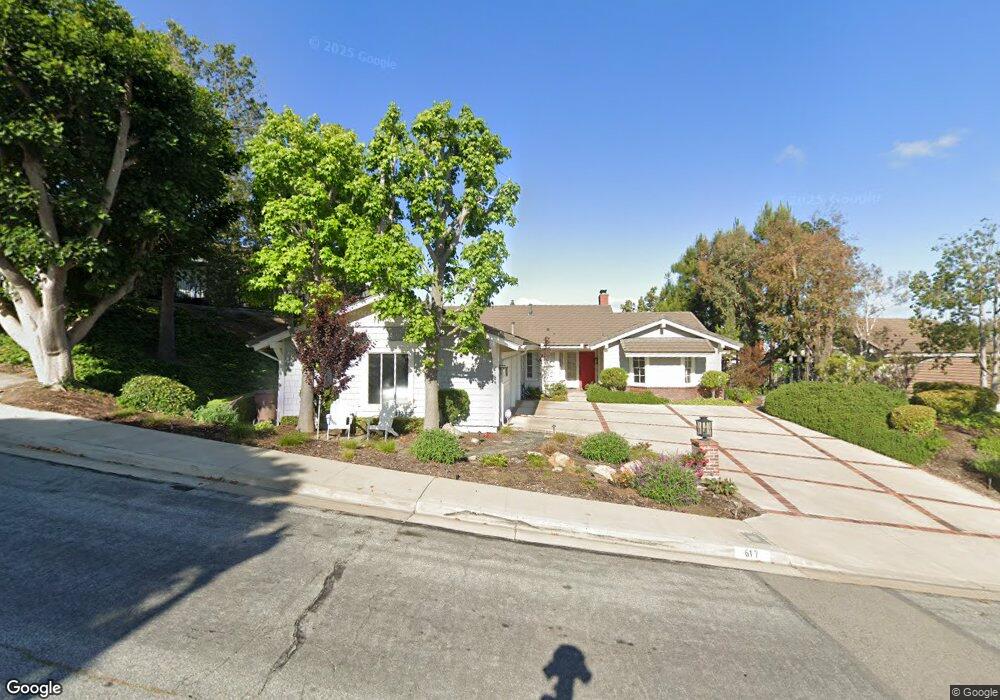
617 S Pathfinder Trail Unit 660 Anaheim, CA 92807
Anaheim Hills NeighborhoodEstimated Value: $237,000 - $295,783
2
Beds
2
Baths
1,136
Sq Ft
$234/Sq Ft
Est. Value
About This Home
This home is located at 617 S Pathfinder Trail Unit 660, Anaheim, CA 92807 and is currently estimated at $266,261, approximately $234 per square foot. 617 S Pathfinder Trail Unit 660 is a home located in Orange County with nearby schools including Imperial Elementary School, Canyon High School, and El Rancho Charter.
Ownership History
Date
Name
Owned For
Owner Type
Purchase Details
Closed on
Dec 29, 2014
Sold by
Gokkes Alice
Bought by
Gokkes Alice and Alice Gokkes Revocable Trust
Current Estimated Value
Purchase Details
Closed on
Dec 16, 2014
Sold by
Schwartz Steven B
Bought by
Gokkes Alice
Purchase Details
Closed on
Aug 31, 2011
Sold by
Schwartz Steven B and Schwartz Linda C
Bought by
Schwartz Steven B and Schwartz Linda C
Purchase Details
Closed on
Jul 15, 2010
Sold by
Zimmerman David
Bought by
Schwartz Steven B and Schwartz Linda C
Purchase Details
Closed on
Dec 3, 2002
Sold by
Marshall Ralph P and Marshall Marion M
Bought by
Marshall Ralph P and Marshall Marion M
Purchase Details
Closed on
Mar 31, 1998
Sold by
Wells Fargo Bk and Golightly Merrill Tr
Bought by
Marshall Ralph P and Marshall Marion M
Create a Home Valuation Report for This Property
The Home Valuation Report is an in-depth analysis detailing your home's value as well as a comparison with similar homes in the area
Home Values in the Area
Average Home Value in this Area
Purchase History
| Date | Buyer | Sale Price | Title Company |
|---|---|---|---|
| Gokkes Alice | -- | None Available | |
| Gokkes Alice | -- | None Available | |
| Schwartz Steven B | -- | None Available | |
| Schwartz Steven B | -- | None Available | |
| Schwartz Steven B | -- | Accommodation | |
| Schwartz Steven B | $85,000 | First American Title Company | |
| Marshall Ralph P | -- | -- | |
| Marshall Ralph P | $179,500 | Fidelity National Title Ins |
Source: Public Records
Tax History Compared to Growth
Tax History
| Year | Tax Paid | Tax Assessment Tax Assessment Total Assessment is a certain percentage of the fair market value that is determined by local assessors to be the total taxable value of land and additions on the property. | Land | Improvement |
|---|---|---|---|---|
| 2025 | $1,936 | $197,676 | $65,435 | $132,241 |
| 2024 | $1,936 | $193,800 | $64,151 | $129,649 |
| 2023 | $1,890 | $190,000 | $62,893 | $127,107 |
| 2022 | $1,198 | $115,220 | $31,104 | $84,116 |
| 2021 | $1,174 | $112,961 | $30,494 | $82,467 |
| 2020 | $1,163 | $111,803 | $30,181 | $81,622 |
| 2019 | $1,140 | $109,611 | $29,589 | $80,022 |
| 2018 | $1,119 | $107,462 | $29,009 | $78,453 |
| 2017 | $1,097 | $105,355 | $28,440 | $76,915 |
| 2016 | $1,079 | $103,290 | $27,883 | $75,407 |
| 2015 | $1,066 | $101,739 | $27,464 | $74,275 |
| 2014 | $1,043 | $99,747 | $26,926 | $72,821 |
Source: Public Records
Map
Nearby Homes
- 5984 E Avenida la Vida
- 562 S Covered Wagon Trail
- 5997 E Calle Principia
- 660 S Covered Wagon Trail
- 6024 E Silverspur Trail
- 6093 E Brighton Ln
- 6070 E Summit Ct Unit 48
- 6073 E Butterfield Ln
- 581 S Paseo Carmel
- 480 S Avenida Faro
- 595 S Avenida Faro
- 397 S San Vicente Ln Unit 31
- 5742 E Hudson Bay Dr
- 463 S Westridge Cir
- 230 S Plaza de Domingos
- 396 Auburn Heights
- 5548 E Vista Del Este
- 5470 E Big Sky Ln
- 5540 E Vista Del Este
- 131 S Francisco St
- 617 S Pathfinder Trail
- 625 S Pathfinder Trail
- 613 S Pathfinder Trail
- 611 S Pathfinder Trail
- 627 S Pathfinder Trail
- 607 S Pathfinder Trail
- 631 S Pathfinder Trail
- 620 S Pathfinder Trail
- 5985 E Settler Ct
- 624 S Pathfinder Trail
- 609 S Pathfinder Trail
- 612 S Pathfinder Trail
- 5965 E Settler Ct
- 626 S Pathfinder Trail
- 630 S Pathfinder Trail
- 635 S Pathfinder Trail
- 603 S Pathfinder Trail
- 608 S Pathfinder Trail
- 5981 E Cowboy Cir
- 5945 E Settler Ct