Estimated Value: $184,000 - $280,000
3
Beds
2
Baths
1,840
Sq Ft
$129/Sq Ft
Est. Value
About This Home
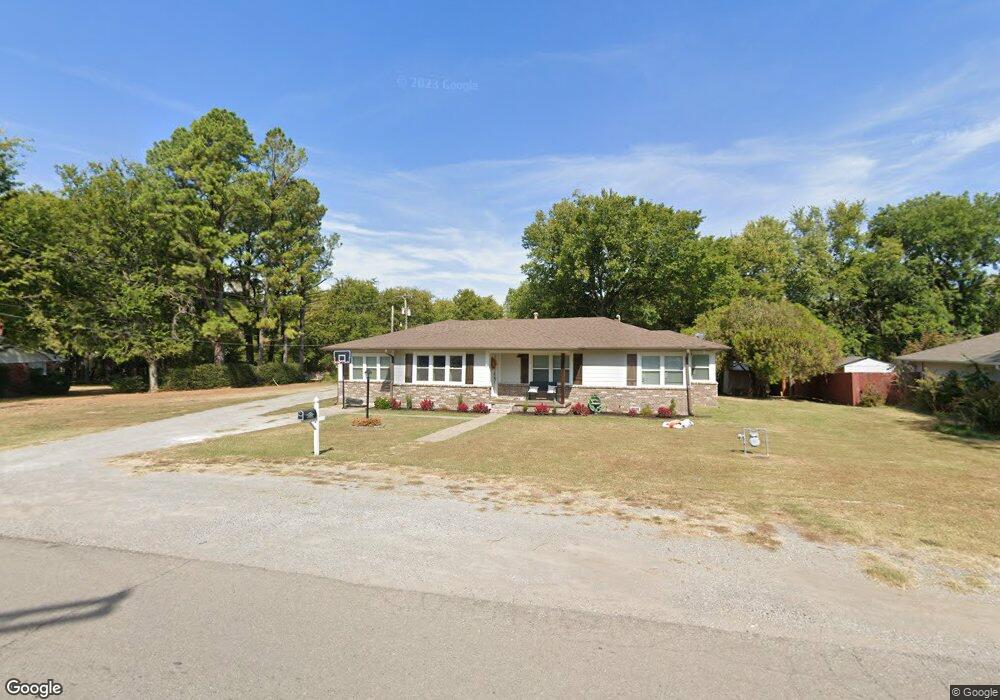
This home is located at 617 SE 2nd St, Pryor, OK 74361 and is currently estimated at $236,972, approximately $128 per square foot. 617 SE 2nd St is a home located in Mayes County with nearby schools including Pryor Middle School, Pryor High School, and William Bradford Christian School.
Ownership History
Date
Name
Owned For
Owner Type
Purchase Details
Closed on
Feb 23, 2017
Sold by
Lml Investments Llc
Bought by
Hood Dylan J and Hood Jessica G
Current Estimated Value
Home Financials for this Owner
Home Financials are based on the most recent Mortgage that was taken out on this home.
Original Mortgage
$132,682
Outstanding Balance
$110,009
Interest Rate
4.25%
Mortgage Type
FHA
Estimated Equity
$126,963
Purchase Details
Closed on
Feb 3, 2016
Sold by
U S Bank Na
Bought by
Lml Investments Llc
Purchase Details
Closed on
Sep 21, 1993
Sold by
Gates Leonard
Bought by
Colston Lloyd
Create a Home Valuation Report for This Property
The Home Valuation Report is an in-depth analysis detailing your home's value as well as a comparison with similar homes in the area
Purchase History
| Date | Buyer | Sale Price | Title Company |
|---|---|---|---|
| Hood Dylan J | $139,900 | Nations Title Of Okc | |
| Lml Investments Llc | $53,000 | First Financial Title Agency | |
| Colston Lloyd | $59,000 | -- |
Source: Public Records
Mortgage History
| Date | Status | Borrower | Loan Amount |
|---|---|---|---|
| Open | Hood Dylan J | $132,682 |
Source: Public Records
Tax History
| Year | Tax Paid | Tax Assessment Tax Assessment Total Assessment is a certain percentage of the fair market value that is determined by local assessors to be the total taxable value of land and additions on the property. | Land | Improvement |
|---|---|---|---|---|
| 2025 | $1,774 | $21,001 | $3,011 | $17,990 |
| 2023 | $1,689 | $19,048 | $2,738 | $16,310 |
| 2022 | $1,516 | $18,141 | $2,738 | $15,403 |
| 2021 | $1,459 | $17,277 | $2,738 | $14,539 |
| 2020 | $1,412 | $17,053 | $2,821 | $14,232 |
| 2019 | $1,396 | $16,344 | $2,649 | $13,695 |
| 2018 | $1,331 | $15,680 | $2,290 | $13,390 |
| 2017 | $1,052 | $13,323 | $2,290 | $11,033 |
| 2016 | $989 | $12,407 | $1,871 | $10,536 |
| 2015 | $641 | $7,915 | $1,871 | $6,044 |
| 2014 | $611 | $7,539 | $1,871 | $5,668 |
Source: Public Records
Map
Nearby Homes
Your Personal Tour Guide
Ask me questions while you tour the home.