617 W Markham Ave Durham, NC 27701
Duke Park NeighborhoodEstimated Value: $340,000 - $419,000
2
Beds
1
Bath
820
Sq Ft
$462/Sq Ft
Est. Value
About This Home
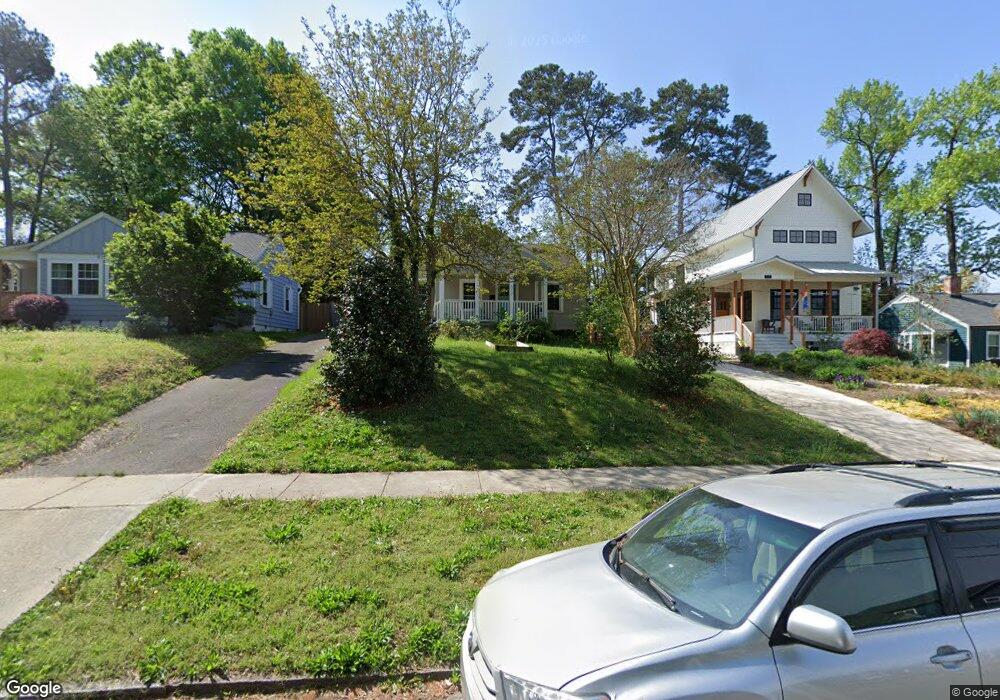
This home is located at 617 W Markham Ave, Durham, NC 27701 and is currently estimated at $378,809, approximately $461 per square foot. 617 W Markham Ave is a home located in Durham County with nearby schools including George Watts Elementary, W.G. Pearson Elementary School, and Brogden Middle.
Ownership History
Date
Name
Owned For
Owner Type
Purchase Details
Closed on
May 1, 2017
Sold by
Slebos Julia
Bought by
Skeen Derek
Current Estimated Value
Purchase Details
Closed on
Jan 9, 2006
Sold by
Seay T Page T and Seay Jennifer
Bought by
Slebos William and Slebos Julie
Home Financials for this Owner
Home Financials are based on the most recent Mortgage that was taken out on this home.
Original Mortgage
$45,900
Interest Rate
6.21%
Mortgage Type
Fannie Mae Freddie Mac
Purchase Details
Closed on
Jul 31, 2000
Sold by
Locklear John Mark and Locklear Erica A
Bought by
Seay T Page
Home Financials for this Owner
Home Financials are based on the most recent Mortgage that was taken out on this home.
Original Mortgage
$42,675
Interest Rate
8.23%
Purchase Details
Closed on
Oct 22, 1998
Sold by
Dreyden Julia I
Bought by
Locklear John Mark
Home Financials for this Owner
Home Financials are based on the most recent Mortgage that was taken out on this home.
Original Mortgage
$53,500
Interest Rate
6.58%
Mortgage Type
Purchase Money Mortgage
Create a Home Valuation Report for This Property
The Home Valuation Report is an in-depth analysis detailing your home's value as well as a comparison with similar homes in the area
Home Values in the Area
Average Home Value in this Area
Purchase History
| Date | Buyer | Sale Price | Title Company |
|---|---|---|---|
| Skeen Derek | $203,500 | -- | |
| Slebos William | $51,000 | -- | |
| Seay T Page | $57,000 | -- | |
| Locklear John Mark | $53,500 | -- |
Source: Public Records
Mortgage History
| Date | Status | Borrower | Loan Amount |
|---|---|---|---|
| Previous Owner | Slebos William | $45,900 | |
| Previous Owner | Seay T Page | $42,675 | |
| Previous Owner | Locklear John Mark | $53,500 |
Source: Public Records
Tax History
| Year | Tax Paid | Tax Assessment Tax Assessment Total Assessment is a certain percentage of the fair market value that is determined by local assessors to be the total taxable value of land and additions on the property. | Land | Improvement |
|---|---|---|---|---|
| 2025 | $3,827 | $386,059 | $236,925 | $149,134 |
| 2024 | $2,958 | $212,026 | $87,750 | $124,276 |
| 2023 | $2,777 | $212,026 | $87,750 | $124,276 |
| 2022 | $2,714 | $212,026 | $87,750 | $124,276 |
| 2021 | $2,701 | $212,026 | $87,750 | $124,276 |
| 2020 | $2,637 | $212,026 | $87,750 | $124,276 |
| 2019 | $2,637 | $212,026 | $87,750 | $124,276 |
| 2018 | $2,677 | $195,221 | $43,912 | $151,309 |
| 2017 | $1,047 | $77,765 | $43,912 | $33,853 |
| 2016 | $1,255 | $99,291 | $43,912 | $55,379 |
| 2015 | $903 | $65,199 | $21,610 | $43,589 |
| 2014 | $903 | $65,199 | $21,610 | $43,589 |
Source: Public Records
Map
Nearby Homes
- 813 W Knox St
- 808 W Knox St
- 1413 Arbor St
- 303 Clark St
- 1711 Glendale Ave
- 807 W Trinity Ave Unit 153
- 807 W Trinity Ave Unit 144
- 807 W Trinity Ave Unit 205
- 807 W Trinity Ave Unit 252
- 1110 N Gregson St
- 1313 Acadia St
- 807 Englewood Ave
- 1206 N Gregson St
- 210 W Geer St
- 803 W Club Blvd
- 213 Northwood Cir
- 1506 Dexter St
- 204 E Lynch St
- 2010 Moody
- 2008 Moody
- 615 W Markham Ave
- 619 W Markham Ave
- 621 W Markham Ave
- 414 Macon St
- 613 W Markham Ave
- 412 Macon St
- 416 Macon St
- 410 Macon St
- 418 Macon St
- 612 W Markham Ave
- 612 W Markham Ave Unit A
- 612 W Markham Ave Unit B
- 408 Macon St
- 420 Macon St
- 420 Macon St Unit AB
- 614 W Markham Ave
- 611 W Markham Ave
- 616 W Markham Ave
- 608 - 610 Markham Ave
- 608 W Markham Ave
Your Personal Tour Guide
Ask me questions while you tour the home.