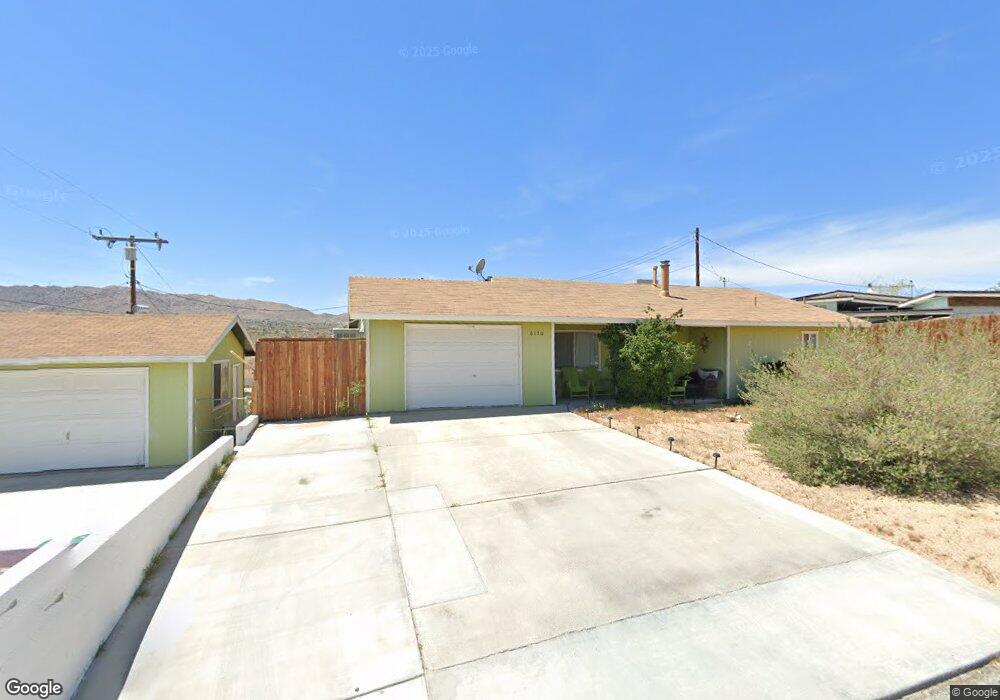
6170 W Parkway Joshua Tree, CA 92252
Estimated Value: $266,000 - $296,000
2
Beds
2
Baths
960
Sq Ft
$293/Sq Ft
Est. Value
About This Home
This home is located at 6170 W Parkway, Joshua Tree, CA 92252 and is currently estimated at $281,660, approximately $293 per square foot. 6170 W Parkway is a home located in San Bernardino County with nearby schools including Joshua Tree Elementary School, La Contenta Middle School, and Yucca Valley High School.
Ownership History
Date
Name
Owned For
Owner Type
Purchase Details
Closed on
Aug 23, 2024
Sold by
Carey Stogner Kay and Stogner Kay Carey
Bought by
Skyline Images Llc
Current Estimated Value
Purchase Details
Closed on
Jun 22, 2016
Sold by
Clem James L
Bought by
Stogner Kay Carey
Purchase Details
Closed on
Nov 18, 1994
Sold by
Hickin Benjamin C
Bought by
Clem James L
Home Financials for this Owner
Home Financials are based on the most recent Mortgage that was taken out on this home.
Original Mortgage
$28,200
Interest Rate
7.5%
Mortgage Type
FHA
Purchase Details
Closed on
Nov 2, 1994
Sold by
Hud
Bought by
Hickin Benjamin C
Home Financials for this Owner
Home Financials are based on the most recent Mortgage that was taken out on this home.
Original Mortgage
$28,200
Interest Rate
7.5%
Mortgage Type
FHA
Purchase Details
Closed on
Jan 28, 1994
Sold by
Quality Loan Service Corp
Bought by
Midland Mtg Co
Create a Home Valuation Report for This Property
The Home Valuation Report is an in-depth analysis detailing your home's value as well as a comparison with similar homes in the area
Home Values in the Area
Average Home Value in this Area
Purchase History
| Date | Buyer | Sale Price | Title Company |
|---|---|---|---|
| Skyline Images Llc | -- | None Listed On Document | |
| Stogner Kay Carey | $58,100 | None Available | |
| Clem James L | $43,000 | First American Title Ins Co | |
| Hickin Benjamin C | $28,500 | Continental Lawyers Title | |
| Midland Mtg Co | $60,908 | United Title Co | |
| Hud | -- | World Title Company |
Source: Public Records
Mortgage History
| Date | Status | Borrower | Loan Amount |
|---|---|---|---|
| Previous Owner | Hickin Benjamin C | $28,200 |
Source: Public Records
Tax History Compared to Growth
Tax History
| Year | Tax Paid | Tax Assessment Tax Assessment Total Assessment is a certain percentage of the fair market value that is determined by local assessors to be the total taxable value of land and additions on the property. | Land | Improvement |
|---|---|---|---|---|
| 2025 | $1,096 | $68,778 | $17,756 | $51,022 |
| 2024 | $1,096 | $67,430 | $17,408 | $50,022 |
| 2023 | $1,076 | $66,108 | $17,067 | $49,041 |
| 2022 | $1,056 | $64,811 | $16,732 | $48,079 |
| 2021 | $1,043 | $63,540 | $16,404 | $47,136 |
| 2020 | $1,033 | $62,889 | $16,236 | $46,653 |
| 2019 | $1,077 | $61,656 | $15,918 | $45,738 |
| 2018 | $910 | $60,447 | $15,606 | $44,841 |
| 2017 | $902 | $59,262 | $15,300 | $43,962 |
| 2016 | $965 | $70,835 | $9,933 | $60,902 |
| 2015 | $926 | $69,771 | $9,784 | $59,987 |
| 2014 | $950 | $68,404 | $9,592 | $58,812 |
Source: Public Records
Map
Nearby Homes
- 6144 Panorama St
- 6123 Scenic Dr
- 6101 Scenic Dr
- 0 Begonia Place Unit IV25254140
- 61707 Morningside Rd
- 61826 Terrace Dr
- 61730 Oleander Dr
- 61740 Oleander Dr
- 6124 El Reposo St
- 61804 Oleander Dr
- 61850 Chollita Rd
- 61959 Begonia Place
- 61956 Aster Place
- 6426 Park Blvd
- 61938 Oleander Dr
- 61974 Terrace Dr
- 0 Valley View St Unit CV23078864
- 61720 Commercial St
- 61947 Petunia Dr
- 61969 Hilltop Dr
- 6169 W Parkway
- 0 Panorama Rd Unit DC21133634
- 0 Panorama Rd Unit JT16769325
- 0 Panorama Rd Unit JT16769142
- 0 Panorama Rd Unit 41410834
- 6216 Morningside Rd
- 61738 Morningside Rd
- 6168 Panorama St
- 6198 Morningside Rd
- 6187 Sunset Rd
- 61732 Morningside Rd
- 61700 W Parkway
- 61700 West Pkwy
- 6131 Panorama St
- 6142 Morningside Rd
- 6201 Sunset Rd
- 6238 Morningside Rd
- 6214 W Parkway
- 6140 Panorama St
- 6137 Sunset Rd