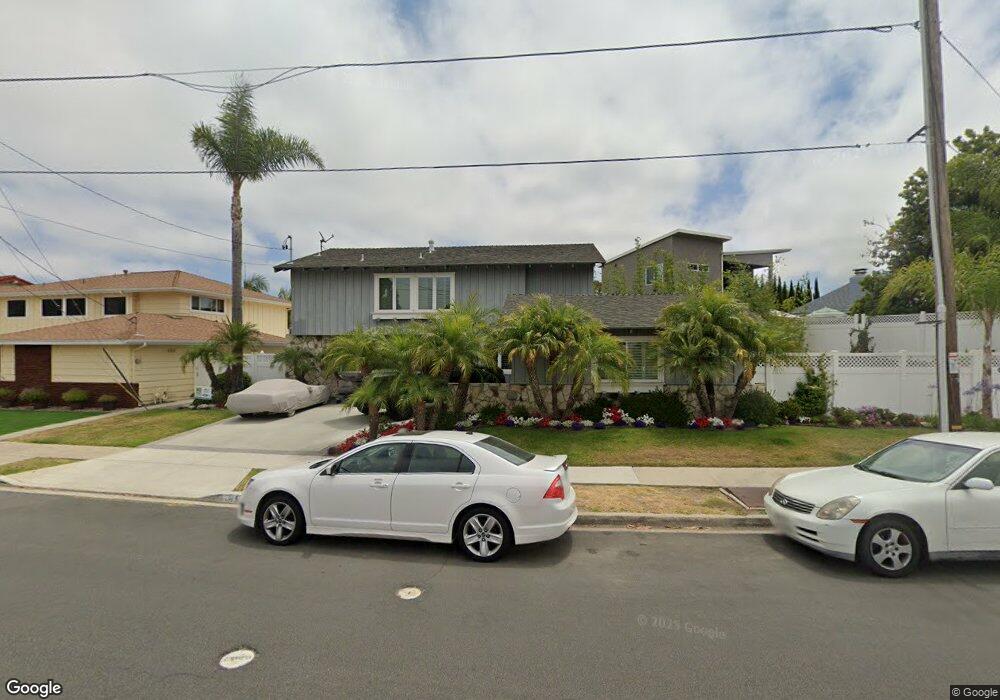
6175 Mercer St San Diego, CA 92122
University City NeighborhoodEstimated Value: $1,571,971 - $1,869,000
5
Beds
3
Baths
2,383
Sq Ft
$739/Sq Ft
Est. Value
About This Home
This home is located at 6175 Mercer St, San Diego, CA 92122 and is currently estimated at $1,760,993, approximately $738 per square foot. 6175 Mercer St is a home located in San Diego County with nearby schools including Spreckels Elementary School, Standley Middle School, and University City High School.
Ownership History
Date
Name
Owned For
Owner Type
Purchase Details
Closed on
Feb 7, 2013
Sold by
Williams Gerald A and Williams Paulette B
Bought by
Williams Gerald A and Williams Paulette B
Current Estimated Value
Home Financials for this Owner
Home Financials are based on the most recent Mortgage that was taken out on this home.
Original Mortgage
$414,000
Outstanding Balance
$288,470
Interest Rate
3.34%
Mortgage Type
New Conventional
Estimated Equity
$1,472,523
Purchase Details
Closed on
Apr 27, 1999
Sold by
Williams Gerald A and Williams Paulette B
Bought by
Williams Gerald A and Williams Paulette B
Home Financials for this Owner
Home Financials are based on the most recent Mortgage that was taken out on this home.
Original Mortgage
$230,000
Interest Rate
6.98%
Purchase Details
Closed on
Jul 7, 1998
Sold by
Williams Gerald A and Williams Paulette B
Bought by
The Williams Family Trust
Purchase Details
Closed on
Aug 19, 1985
Create a Home Valuation Report for This Property
The Home Valuation Report is an in-depth analysis detailing your home's value as well as a comparison with similar homes in the area
Home Values in the Area
Average Home Value in this Area
Purchase History
| Date | Buyer | Sale Price | Title Company |
|---|---|---|---|
| Williams Gerald A | -- | Accommodation | |
| Williams Gerald A | -- | Stewart Title Of California | |
| Williams Gerald A | -- | United Title Company | |
| The Williams Family Trust | -- | -- | |
| -- | $165,000 | -- |
Source: Public Records
Mortgage History
| Date | Status | Borrower | Loan Amount |
|---|---|---|---|
| Open | Williams Gerald A | $414,000 | |
| Closed | Williams Gerald A | $230,000 |
Source: Public Records
Tax History Compared to Growth
Tax History
| Year | Tax Paid | Tax Assessment Tax Assessment Total Assessment is a certain percentage of the fair market value that is determined by local assessors to be the total taxable value of land and additions on the property. | Land | Improvement |
|---|---|---|---|---|
| 2025 | $1,906 | $328,550 | $74,317 | $254,233 |
| 2024 | $1,906 | $322,109 | $72,860 | $249,249 |
| 2023 | $1,929 | $315,794 | $71,432 | $244,362 |
| 2022 | $1,974 | $309,603 | $70,032 | $239,571 |
| 2021 | $1,955 | $303,533 | $68,659 | $234,874 |
| 2020 | $1,965 | $300,421 | $67,955 | $232,466 |
| 2019 | $1,944 | $294,531 | $66,623 | $227,908 |
| 2018 | $1,842 | $288,757 | $65,317 | $223,440 |
| 2017 | $1,812 | $283,096 | $64,037 | $219,059 |
| 2016 | $1,791 | $277,546 | $62,782 | $214,764 |
| 2015 | $1,756 | $273,378 | $61,839 | $211,539 |
| 2014 | $1,717 | $268,024 | $60,628 | $207,396 |
Source: Public Records
Map
Nearby Homes
- 3542 Governor Dr
- 3736 Millikin Ave
- 3426 Millikin Ave
- 6614 Dennison St
- 6547 Radcliffe Dr
- 6330 Genesee Ave Unit 112
- 6330 Genesee Ave Unit 220
- 6330 Genesee Ave Unit 213
- 6036 Tulane St
- 6174 Syracuse Way
- 3598 Syracuse Ave
- 6188 Agee St Unit 230
- 5822 Stadium St
- 6214 Agee St Unit 34
- 5962 Agee St
- 5738 Lodi St
- 7849 Camino Glorita
- 5889 Cozzens St
- 7833 Camino Huerta
- 2925 Fried Ave
- 6211 Mercer St
- 3602 Governor Dr
- 3616 Governor Dr
- 6233 Mercer St
- 3581 Stetson Ave
- 6150 Mercer St
- 3590 Stetson Ave Unit 5
- 3582 Governor Dr
- 3625 Millikin Ave
- 6255 Mercer St
- 6234 Mercer St
- 3571 Stetson Ave
- 3632 Governor Dr
- 3572 Governor Dr
- 3580 Stetson Ave
- 6256 Mercer St
- 3633 Millikin Ave
- 3561 Stetson Ave
- 3640 Governor Dr
- 3570 Stetson Ave