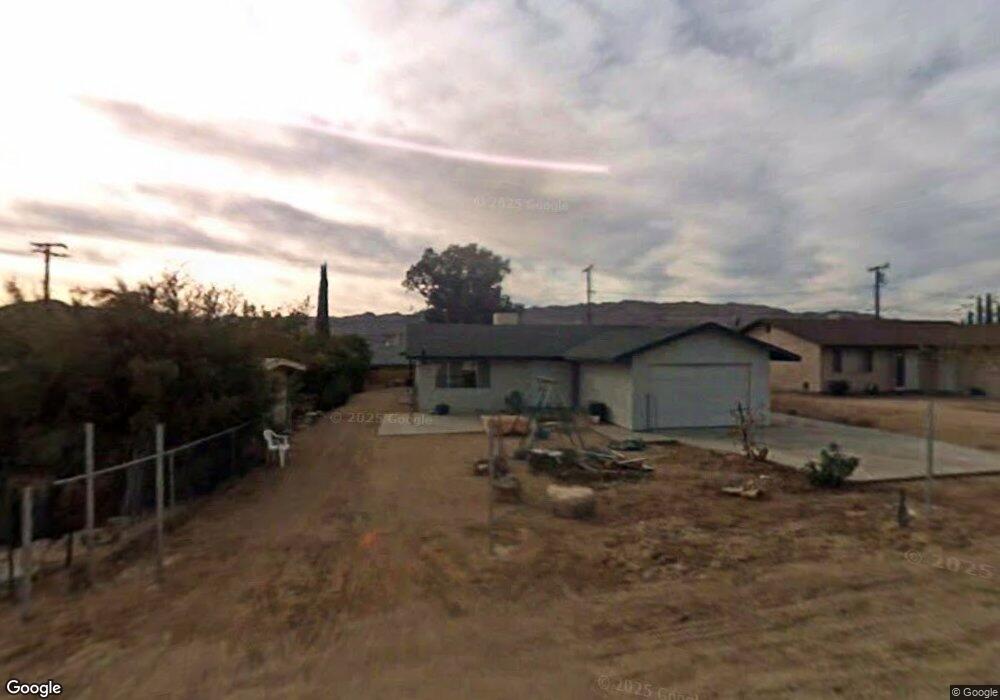
61769 Oleander Dr Joshua Tree, CA 92252
Estimated Value: $315,000 - $351,000
3
Beds
2
Baths
2,028
Sq Ft
$163/Sq Ft
Est. Value
About This Home
This home is located at 61769 Oleander Dr, Joshua Tree, CA 92252 and is currently estimated at $331,038, approximately $163 per square foot. 61769 Oleander Dr is a home located in San Bernardino County with nearby schools including Joshua Tree Elementary School, La Contenta Middle School, and Yucca Valley High School.
Ownership History
Date
Name
Owned For
Owner Type
Purchase Details
Closed on
Jul 20, 2007
Sold by
Dauphinais Chris J
Bought by
Dauphinais Chris J and Dauphinais Sally A
Current Estimated Value
Home Financials for this Owner
Home Financials are based on the most recent Mortgage that was taken out on this home.
Original Mortgage
$157,500
Outstanding Balance
$99,619
Interest Rate
6.73%
Mortgage Type
New Conventional
Estimated Equity
$231,419
Purchase Details
Closed on
Dec 20, 1999
Sold by
Amos Sally A
Bought by
Amos Sally A and Dauphinais Chris J
Purchase Details
Closed on
Jul 7, 1995
Sold by
Farmers Home Admin
Bought by
Amos Sally A
Home Financials for this Owner
Home Financials are based on the most recent Mortgage that was taken out on this home.
Original Mortgage
$51,500
Interest Rate
7.63%
Mortgage Type
Seller Take Back
Purchase Details
Closed on
Mar 1, 1995
Sold by
Chatriand Wayne D
Bought by
Farmers Home Administration and United States Department Of Agriculture
Create a Home Valuation Report for This Property
The Home Valuation Report is an in-depth analysis detailing your home's value as well as a comparison with similar homes in the area
Home Values in the Area
Average Home Value in this Area
Purchase History
| Date | Buyer | Sale Price | Title Company |
|---|---|---|---|
| Dauphinais Chris J | -- | Chicago Title | |
| Dauphinais Chris J | -- | Chicago Title | |
| Amos Sally A | -- | -- | |
| Amos Sally A | $51,500 | Fidelity National Title Ins | |
| Farmers Home Administration | $50,265 | First American Title Ins Co |
Source: Public Records
Mortgage History
| Date | Status | Borrower | Loan Amount |
|---|---|---|---|
| Open | Dauphinais Chris J | $157,500 | |
| Closed | Amos Sally A | $51,500 |
Source: Public Records
Tax History
| Year | Tax Paid | Tax Assessment Tax Assessment Total Assessment is a certain percentage of the fair market value that is determined by local assessors to be the total taxable value of land and additions on the property. | Land | Improvement |
|---|---|---|---|---|
| 2025 | $1,916 | $145,645 | $14,952 | $130,693 |
| 2024 | $1,853 | $142,789 | $14,659 | $128,130 |
| 2023 | $1,817 | $139,990 | $14,372 | $125,618 |
| 2022 | $1,780 | $137,245 | $14,090 | $123,155 |
| 2021 | $1,758 | $134,554 | $13,814 | $120,740 |
| 2020 | $1,742 | $133,174 | $13,672 | $119,502 |
| 2019 | $1,835 | $130,563 | $13,404 | $117,159 |
| 2018 | $1,659 | $128,003 | $13,141 | $114,862 |
| 2017 | $1,641 | $125,493 | $12,883 | $112,610 |
| 2016 | $1,613 | $123,032 | $12,630 | $110,402 |
| 2015 | $1,444 | $110,145 | $12,440 | $97,705 |
| 2014 | $1,453 | $107,987 | $12,196 | $95,791 |
Source: Public Records
Map
Nearby Homes
- 61740 Oleander Dr
- 61826 Terrace Dr
- 61819 Petunia Dr
- 6101 Scenic Dr
- 5960 Park Blvd
- 6123 Scenic Dr
- 0 Begonia Place Unit IV25254140
- 6144 Panorama St
- 61791 Oleander Dr
- 6124 El Reposo St
- 61938 Oleander Dr
- 6186 El Reposo St
- 61707 Morningside Rd
- 5954 Valley View St
- 61880 Verbena Rd
- 61954 Plaza Rd
- 61850 Chollita Rd
- 1 Hilltop Dr
- 6426 Park Blvd
- 6360 El Reposo St
- 61779 Oleander Dr
- 61759 Oleander Dr
- 61774 Terrace Dr
- 61782 Terrace Dr
- 61770 Oleander Dr
- 61780 Terrace Dr
- 61780 Oleander Dr
- 61760 Oleander Dr
- 61739 Oleander Dr
- 61746 Terrace Dr
- 61750 Oleander Dr
- 61736 Terrace Dr
- 61729 Oleander Dr
- 61805 Oleander Dr
- 61775 Terrace Dr
- 61804 Terrace Dr
- 61771 Petunia Dr
- 61781 Petunia Dr
- 61761 Petunia Dr
- 61728 Terrace Dr
Your Personal Tour Guide
Ask me questions while you tour the home.