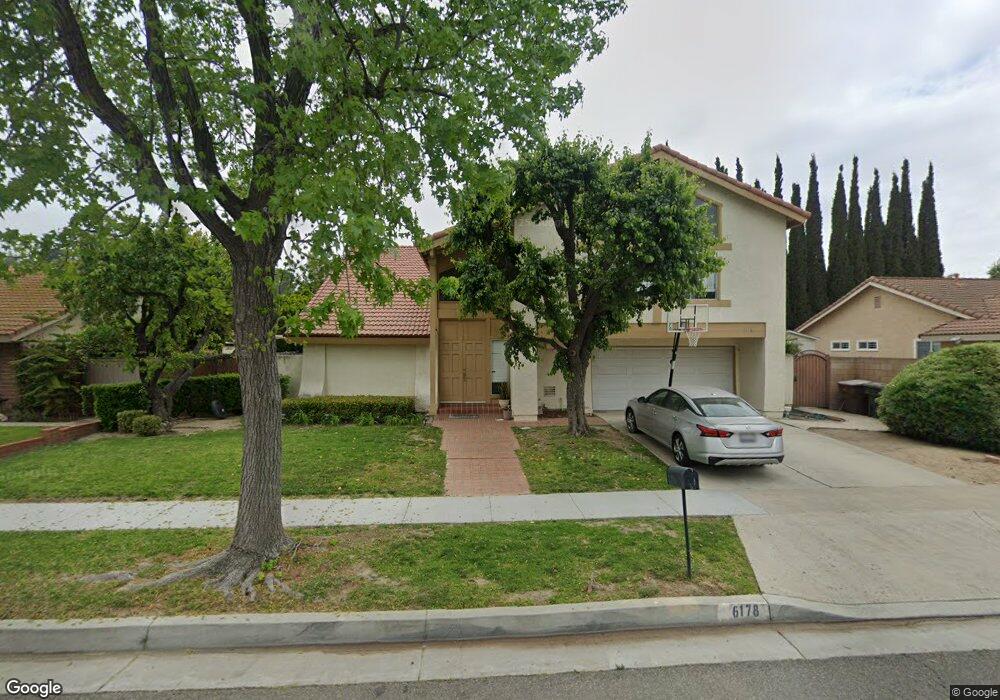
6178 E Palo Alto Dr Anaheim, CA 92807
Anaheim Hills NeighborhoodEstimated Value: $1,479,624 - $1,499,000
4
Beds
3
Baths
2,953
Sq Ft
$504/Sq Ft
Est. Value
About This Home
This home is located at 6178 E Palo Alto Dr, Anaheim, CA 92807 and is currently estimated at $1,488,156, approximately $503 per square foot. 6178 E Palo Alto Dr is a home located in Orange County with nearby schools including Crescent Elementary School, Canyon High School, and El Rancho Charter.
Ownership History
Date
Name
Owned For
Owner Type
Purchase Details
Closed on
Jun 24, 2014
Sold by
Burke Squire and Burke Tillie
Bought by
Stendtner James and Steudtner Melissa
Current Estimated Value
Purchase Details
Closed on
Sep 2, 2010
Sold by
Canyon Acres Children Family Services
Bought by
Steudtner James and Steudtner Melissa
Home Financials for this Owner
Home Financials are based on the most recent Mortgage that was taken out on this home.
Original Mortgage
$538,346
Interest Rate
4.5%
Mortgage Type
FHA
Purchase Details
Closed on
Dec 8, 2003
Sold by
Canyon Acres Childrens Services
Bought by
Canyon Acres Childrens Services
Home Financials for this Owner
Home Financials are based on the most recent Mortgage that was taken out on this home.
Original Mortgage
$390,000
Interest Rate
5.92%
Mortgage Type
Purchase Money Mortgage
Create a Home Valuation Report for This Property
The Home Valuation Report is an in-depth analysis detailing your home's value as well as a comparison with similar homes in the area
Home Values in the Area
Average Home Value in this Area
Purchase History
| Date | Buyer | Sale Price | Title Company |
|---|---|---|---|
| Stendtner James | -- | Lawyers Title | |
| Steudtner James | $585,000 | Lsi | |
| Canyon Acres Childrens Services | -- | Gateway |
Source: Public Records
Mortgage History
| Date | Status | Borrower | Loan Amount |
|---|---|---|---|
| Previous Owner | Steudtner James | $538,346 | |
| Previous Owner | Canyon Acres Childrens Services | $390,000 |
Source: Public Records
Tax History Compared to Growth
Tax History
| Year | Tax Paid | Tax Assessment Tax Assessment Total Assessment is a certain percentage of the fair market value that is determined by local assessors to be the total taxable value of land and additions on the property. | Land | Improvement |
|---|---|---|---|---|
| 2025 | $8,086 | $749,483 | $539,032 | $210,451 |
| 2024 | $8,086 | $734,788 | $528,463 | $206,325 |
| 2023 | $7,907 | $720,381 | $518,101 | $202,280 |
| 2022 | $7,753 | $706,256 | $507,942 | $198,314 |
| 2021 | $7,535 | $692,408 | $497,982 | $194,426 |
| 2020 | $7,465 | $685,309 | $492,876 | $192,433 |
| 2019 | $7,369 | $671,872 | $483,212 | $188,660 |
| 2018 | $7,255 | $658,699 | $473,738 | $184,961 |
| 2017 | $6,951 | $645,784 | $464,449 | $181,335 |
| 2016 | $6,815 | $633,122 | $455,342 | $177,780 |
| 2015 | $6,726 | $623,612 | $448,502 | $175,110 |
| 2014 | $6,583 | $611,397 | $439,717 | $171,680 |
Source: Public Records
Map
Nearby Homes
- 157 S Donna Ct
- 242 N Camino Arroyo
- 131 S Francisco St
- 397 S San Vicente Ln Unit 31
- 6189 E Camino Manzano
- 7350 E Calle Durango
- 5901 E Firenze Crescent
- 6587 E Via Arboles
- 6554 E Via Estrada
- 7583 E Country Hill Ln
- 6093 E Brighton Ln
- 5997 E Calle Principia
- 5815 E La Palma Ave Unit 74
- 5815 E La Palma Ave Unit 190
- 5815 E La Palma Ave Unit 133
- 6633 E Paseo Del Norte
- 5984 E Avenida la Vida
- 396 Auburn Heights
- 6070 E Summit Ct Unit 48
- 7580 E Martella Ln
- 6184 E Palo Alto Dr
- 6170 E Palo Alto Dr
- 105 S Bonnie Gene Ln
- 6190 E Palo Alto Dr
- 6166 E Palo Alto Dr
- 6179 E Palo Alto Dr
- 6175 E Palo Alto Dr
- 6185 E Palo Alto Dr
- 100 S Bayberry Ct
- 6171 E Palo Alto Dr
- 6170 E Arboretum Rd
- 115 S Bonnie Gene Ln
- 6191 E Palo Alto Dr
- 6196 E Palo Alto Dr
- 6160 E Palo Alto Dr
- 6163 E Palo Alto Dr
- 110 S Bayberry Ct
- 6172 E Baja Dr
- 6180 E Arboretum Rd
- 6166 E Baja Dr