618 14th Ave E West Fargo, ND 58078
Charleswood NeighborhoodEstimated Value: $256,204
About This Home
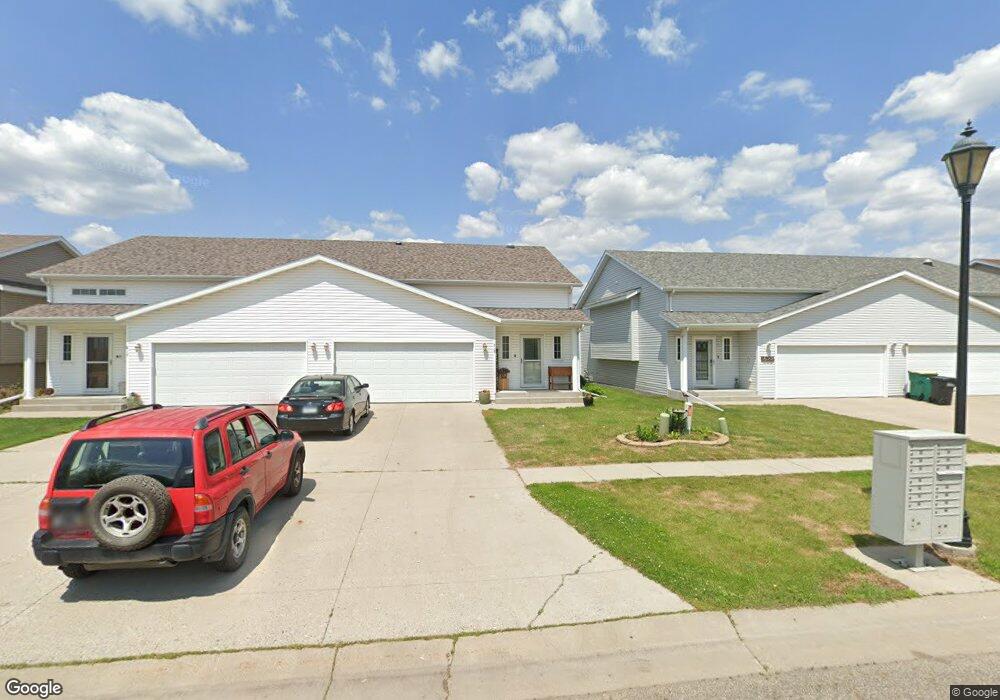
This home is located at 618 14th Ave E, West Fargo, ND 58078 and is currently estimated at $256,204, approximately $139 per square foot. 618 14th Ave E is a home located in Cass County with nearby schools including South Elementary School, Cheney Middle School, and West Fargo High School.
Ownership History
We collect this data history from publicly available records. To have your information removed, we recommend requesting removal directly through your county’s website.
Purchase Details
Home Financials for this Owner
Home Financials are based on the most recent Mortgage that was taken out on this home.Purchase Details
Home Financials for this Owner
Home Financials are based on the most recent Mortgage that was taken out on this home.Purchase Details
Home Financials for this Owner
Home Financials are based on the most recent Mortgage that was taken out on this home.Home Values in the Area
Average Home Value in this Area
Purchase History
We collect this data history from publicly available records. To have your information removed, we recommend requesting removal directly through your county’s website.
| Date | Buyer | Sale Price | Title Company |
|---|---|---|---|
| $205,000 | Plains Title Llc | ||
| $134,000 | None Available | ||
| -- | -- |
Mortgage History
We collect this data history from publicly available records. To have your information removed, we recommend requesting removal directly through your county’s website.
| Date | Status | Borrower | Loan Amount |
|---|---|---|---|
| Open | $201,286 | ||
| Previous Owner | $107,200 | ||
| Previous Owner | $113,490 |
Tax History
We collect this data history from publicly available records. To have your information removed, we recommend requesting removal directly through your county’s website.
| Year | Tax Paid | Tax Assessment Tax Assessment Total Assessment is a certain percentage of the fair market value that is determined by local assessors to be the total taxable value of land and additions on the property. | Land | Improvement |
|---|---|---|---|---|
| 2025 | $2,136 | $120,550 | $18,500 | $102,050 |
| 2024 | $2,922 | $115,100 | $16,850 | $98,250 |
| 2023 | $3,266 | $108,550 | $16,850 | $91,700 |
| 2022 | $3,217 | $102,050 | $16,850 | $85,200 |
| 2021 | $3,661 | $92,400 | $14,300 | $78,100 |
| 2020 | $3,514 | $90,150 | $14,300 | $75,850 |
| 2019 | $3,349 | $89,700 | $14,300 | $75,400 |
| 2018 | $3,253 | $88,950 | $14,300 | $74,650 |
| 2017 | $3,173 | $86,250 | $14,300 | $71,950 |
| 2016 | $3,086 | $84,050 | $14,300 | $69,750 |
| 2015 | $3,072 | $76,250 | $6,950 | $69,300 |
| 2014 | $2,932 | $71,250 | $6,950 | $64,300 |
| 2013 | $2,912 | $68,000 | $6,150 | $61,850 |
Map
- 602 12 1 2 Ave E Unit 5
- 307 12th Ave E
- 239 12 1 2 Ave E
- 622 12th Ave E
- 205 12th Ave E
- 816 Lakeridge Place
- 840 Lakeridge Place
- 302 10th Ave E
- 883 Lakeridge Place
- 715 Northridge Way
- 1469 12th Street Ct
- 1816 Queensbury St
- 1811 7th St E
- 1224 Cedar Way
- 1536 Cambridge Dr
- 1827 7th St E
- 1731 6th St E
- 1814 Brentwood Ct
- 208 10 1/2 Ave W
- 1844 1st St
- 622 14th Ave E
- 616 14th Ave E
- 624 14th Ave E
- 612 14th Ave E
- 617 13 1/2 Ave E
- 621 13 1/2 Ave E
- 615 13 1/2 Ave E
- 621 13 1 2 Ave S
- 610 14th Ave E
- 617 13 1 2 Ave S
- 615 13 1 2 Ave S
- 623 13 1/2 Ave E
- 611 13 1/2 Ave E
- 708 14th Ave E
- 606 14th Ave E
- 705 13 1/2 Ave E
- 705 13 1 2 Ave S
- 609 13 1/2 Ave E
- 609 13 1 2 Ave S
- 707 13 1/2 Ave E
Ask me questions while you tour the home.