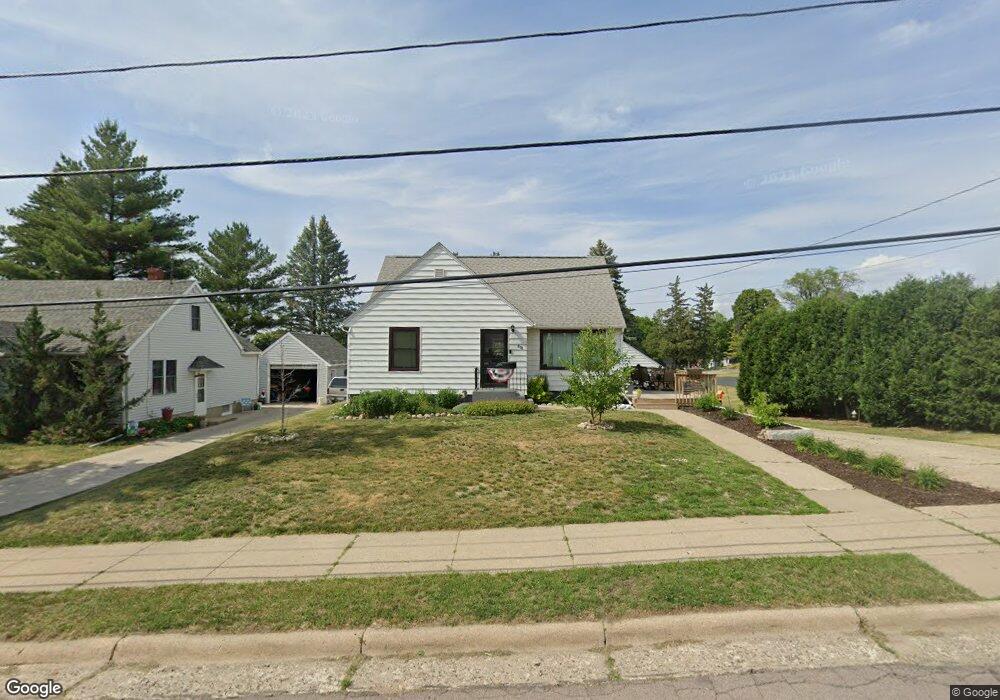
618 3rd St SW Faribault, MN 55021
Estimated Value: $246,000 - $274,000
2
Beds
2
Baths
1,207
Sq Ft
$213/Sq Ft
Est. Value
About This Home
This home is located at 618 3rd St SW, Faribault, MN 55021 and is currently estimated at $256,967, approximately $212 per square foot. 618 3rd St SW is a home located in Rice County with nearby schools including Jefferson Elementary School, Faribault Middle School, and Faribault Senior High School.
Ownership History
Date
Name
Owned For
Owner Type
Purchase Details
Closed on
Jul 22, 2016
Sold by
Maas Ryan P and Semmann Lindsey
Bought by
Grage Tamara J
Current Estimated Value
Home Financials for this Owner
Home Financials are based on the most recent Mortgage that was taken out on this home.
Original Mortgage
$143,060
Outstanding Balance
$113,426
Interest Rate
3.37%
Mortgage Type
FHA
Estimated Equity
$143,541
Purchase Details
Closed on
Jul 22, 2015
Sold by
Maas Ryan Ryan
Bought by
Grage Tamara Tamara
Home Financials for this Owner
Home Financials are based on the most recent Mortgage that was taken out on this home.
Original Mortgage
$143,060
Interest Rate
4.09%
Purchase Details
Closed on
Sep 29, 2006
Sold by
Tinaglia Drew A and Tinaglia Sheryl C
Bought by
Maas Ryan P
Purchase Details
Closed on
Oct 31, 2000
Sold by
Korman Debbie A
Bought by
Tinaglis Drew A
Create a Home Valuation Report for This Property
The Home Valuation Report is an in-depth analysis detailing your home's value as well as a comparison with similar homes in the area
Home Values in the Area
Average Home Value in this Area
Purchase History
| Date | Buyer | Sale Price | Title Company |
|---|---|---|---|
| Grage Tamara J | $148,000 | Edina Realty Title Inc | |
| Grage Tamara Tamara | $148,000 | -- | |
| Maas Ryan P | $163,900 | -- | |
| Tinaglis Drew A | $112,000 | -- |
Source: Public Records
Mortgage History
| Date | Status | Borrower | Loan Amount |
|---|---|---|---|
| Open | Grage Tamara J | $143,060 | |
| Previous Owner | Grage Tamara Tamara | $143,060 |
Source: Public Records
Tax History
| Year | Tax Paid | Tax Assessment Tax Assessment Total Assessment is a certain percentage of the fair market value that is determined by local assessors to be the total taxable value of land and additions on the property. | Land | Improvement |
|---|---|---|---|---|
| 2025 | $2,606 | $243,000 | $64,900 | $178,100 |
| 2024 | $2,606 | $217,800 | $61,000 | $156,800 |
| 2023 | $2,420 | $217,800 | $61,000 | $156,800 |
| 2022 | $2,182 | $212,300 | $64,900 | $147,400 |
| 2021 | $2,012 | $183,200 | $52,300 | $130,900 |
| 2020 | $1,912 | $170,200 | $50,200 | $120,000 |
| 2019 | $1,764 | $165,600 | $50,200 | $115,400 |
| 2018 | $1,574 | $153,400 | $46,000 | $107,400 |
| 2017 | $1,440 | $137,000 | $41,900 | $95,100 |
| 2016 | $1,348 | $124,400 | $41,900 | $82,500 |
| 2015 | $1,368 | $116,100 | $33,500 | $82,600 |
| 2014 | -- | $121,800 | $41,900 | $79,900 |
Source: Public Records
Map
Nearby Homes
Your Personal Tour Guide
Ask me questions while you tour the home.