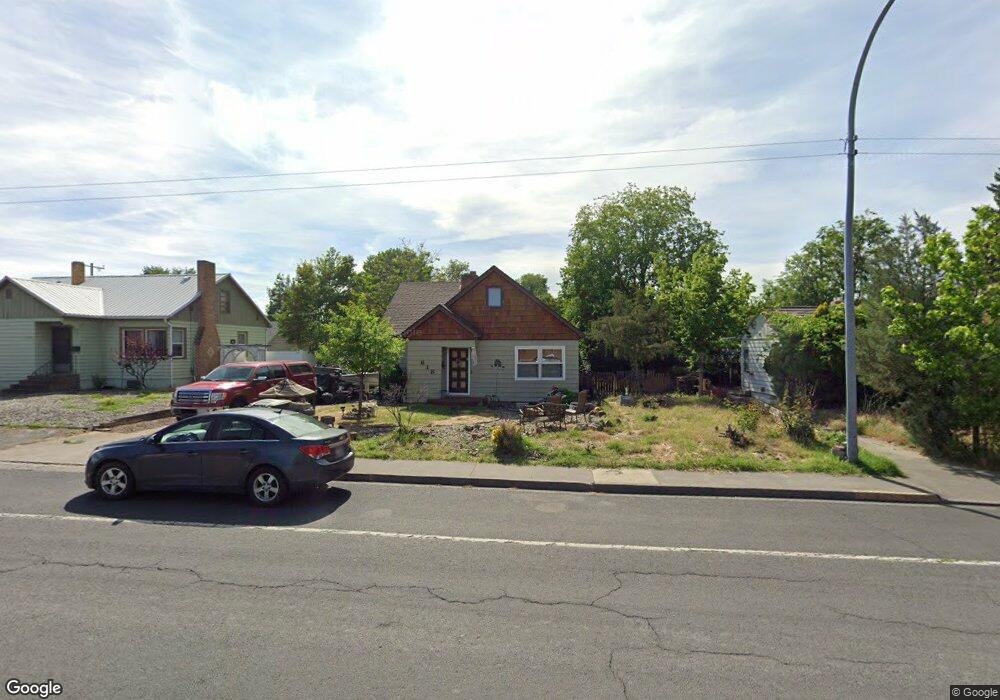
618 6th St Clarkston, WA 99403
Estimated Value: $301,000 - $366,728
4
Beds
3
Baths
1,806
Sq Ft
$185/Sq Ft
Est. Value
About This Home
This home is located at 618 6th St, Clarkston, WA 99403 and is currently estimated at $333,682, approximately $184 per square foot. 618 6th St is a home located in Asotin County with nearby schools including Grantham Elementary School, Lincoln Middle School, and Charles Francis Adams High School.
Ownership History
Date
Name
Owned For
Owner Type
Purchase Details
Closed on
May 3, 2018
Sold by
Howard Morgan B
Bought by
Howard James M
Current Estimated Value
Purchase Details
Closed on
Oct 21, 2011
Sold by
Hewitt Jacob L and Hewitt Michelle D
Bought by
Howard James M and Howard Morgan B
Home Financials for this Owner
Home Financials are based on the most recent Mortgage that was taken out on this home.
Original Mortgage
$148,926
Outstanding Balance
$100,440
Interest Rate
3.87%
Mortgage Type
FHA
Estimated Equity
$233,242
Purchase Details
Closed on
Feb 8, 2007
Sold by
Weller Edna
Bought by
Hewitt Jacob L and Hewitt Michelle D
Home Financials for this Owner
Home Financials are based on the most recent Mortgage that was taken out on this home.
Original Mortgage
$99,500
Interest Rate
6.17%
Mortgage Type
New Conventional
Create a Home Valuation Report for This Property
The Home Valuation Report is an in-depth analysis detailing your home's value as well as a comparison with similar homes in the area
Home Values in the Area
Average Home Value in this Area
Purchase History
| Date | Buyer | Sale Price | Title Company |
|---|---|---|---|
| Howard James M | -- | None Available | |
| Howard James M | $152,800 | Alliance Title & Escrow | |
| Hewitt Jacob L | $995,000 | First American Title Company |
Source: Public Records
Mortgage History
| Date | Status | Borrower | Loan Amount |
|---|---|---|---|
| Open | Howard James M | $148,926 | |
| Previous Owner | Hewitt Jacob L | $99,500 |
Source: Public Records
Tax History Compared to Growth
Tax History
| Year | Tax Paid | Tax Assessment Tax Assessment Total Assessment is a certain percentage of the fair market value that is determined by local assessors to be the total taxable value of land and additions on the property. | Land | Improvement |
|---|---|---|---|---|
| 2025 | $1,597 | $137,300 | $30,000 | $107,300 |
| 2023 | $1,597 | $137,300 | $30,000 | $107,300 |
| 2022 | $1,577 | $137,300 | $30,000 | $107,300 |
| 2021 | $1,731 | $137,300 | $30,000 | $107,300 |
| 2020 | $1,546 | $137,300 | $30,000 | $107,300 |
| 2019 | $1,495 | $137,300 | $33,000 | $104,300 |
| 2018 | $1,807 | $137,300 | $33,000 | $104,300 |
| 2017 | $1,693 | $137,300 | $33,000 | $104,300 |
| 2016 | $1,693 | $137,300 | $33,000 | $104,300 |
| 2015 | $168 | $133,300 | $33,000 | $100,300 |
| 2013 | $1,696 | $130,400 | $33,000 | $97,400 |
Source: Public Records
Map
Nearby Homes