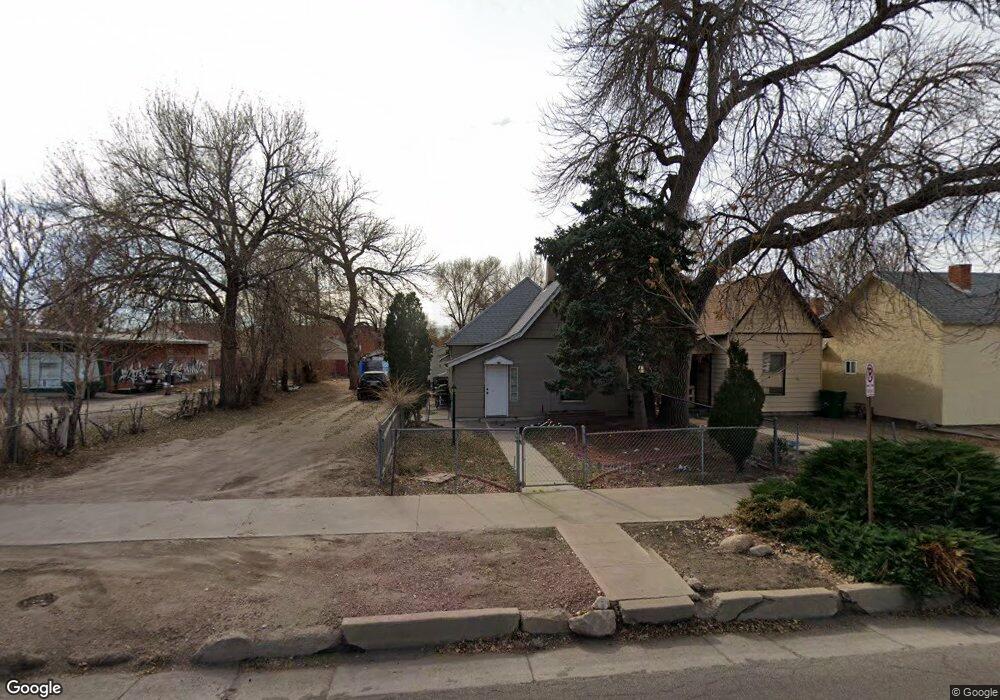
618 E 8th St Pueblo, CO 81001
East Side NeighborhoodEstimated Value: $79,765 - $159,000
2
Beds
1
Bath
793
Sq Ft
$139/Sq Ft
Est. Value
About This Home
This home is located at 618 E 8th St, Pueblo, CO 81001 and is currently estimated at $110,441, approximately $139 per square foot. 618 E 8th St is a home located in Pueblo County with nearby schools including Park View Elementary School, Risley International Academy of Innovation, and Centennial High School.
Ownership History
Date
Name
Owned For
Owner Type
Purchase Details
Closed on
Mar 25, 2025
Sold by
Deherrera Mathew
Bought by
Beeson Shawne E and Snow Holly L
Current Estimated Value
Purchase Details
Closed on
May 22, 2024
Sold by
Ocegueda Dalia Gabriela Figueroa
Bought by
Deherrera Mathew
Purchase Details
Closed on
Jun 7, 2022
Sold by
Jose Dejesus Soto
Bought by
Gabriela Dalia and Ocegueda Figueroa
Purchase Details
Closed on
Sep 3, 2010
Sold by
Miller Brenda Ann
Bought by
Soto Jose De Jesus and Soto Mirna A
Purchase Details
Closed on
Apr 16, 2008
Sold by
Johnson Joseph A and Johnson Patricia A
Bought by
Miller Brenda Ann
Purchase Details
Closed on
Oct 5, 1984
Sold by
Hornbeck Meda Faye + Mildred
Bought by
Johnson Joseph A + Patricia A
Purchase Details
Closed on
May 14, 1974
Sold by
Hornbeck Nellie
Bought by
Hornbeck Meda Faye + Mildred
Create a Home Valuation Report for This Property
The Home Valuation Report is an in-depth analysis detailing your home's value as well as a comparison with similar homes in the area
Home Values in the Area
Average Home Value in this Area
Purchase History
| Date | Buyer | Sale Price | Title Company |
|---|---|---|---|
| Beeson Shawne E | $83,000 | Fntc (Fidelity National Title) | |
| Deherrera Mathew | $80,000 | Fidelity National Title | |
| Gabriela Dalia | $75,000 | None Listed On Document | |
| Soto Jose De Jesus | $35,000 | None Available | |
| Miller Brenda Ann | $39,995 | Land Title Guarantee Company | |
| Johnson Joseph A + Patricia A | $30,000 | -- | |
| Hornbeck Meda Faye + Mildred | -- | -- |
Source: Public Records
Mortgage History
| Date | Status | Borrower | Loan Amount |
|---|---|---|---|
| Closed | Gabriela Dalia | $0 |
Source: Public Records
Tax History
| Year | Tax Paid | Tax Assessment Tax Assessment Total Assessment is a certain percentage of the fair market value that is determined by local assessors to be the total taxable value of land and additions on the property. | Land | Improvement |
|---|---|---|---|---|
| 2024 | $681 | $6,900 | -- | -- |
| 2023 | $689 | $10,590 | $1,010 | $9,580 |
| 2022 | $581 | $5,848 | $240 | $5,608 |
| 2021 | $599 | $6,020 | $250 | $5,770 |
| 2020 | $356 | $3,530 | $100 | $3,430 |
| 2019 | $357 | $3,538 | $103 | $3,435 |
| 2018 | $233 | $2,571 | $104 | $2,467 |
| 2017 | $235 | $2,571 | $104 | $2,467 |
| 2016 | $223 | $2,451 | $115 | $2,336 |
| 2015 | $222 | $2,451 | $115 | $2,336 |
| 2014 | $242 | $2,663 | $115 | $2,548 |
Source: Public Records
Map
Nearby Homes
Your Personal Tour Guide
Ask me questions while you tour the home.