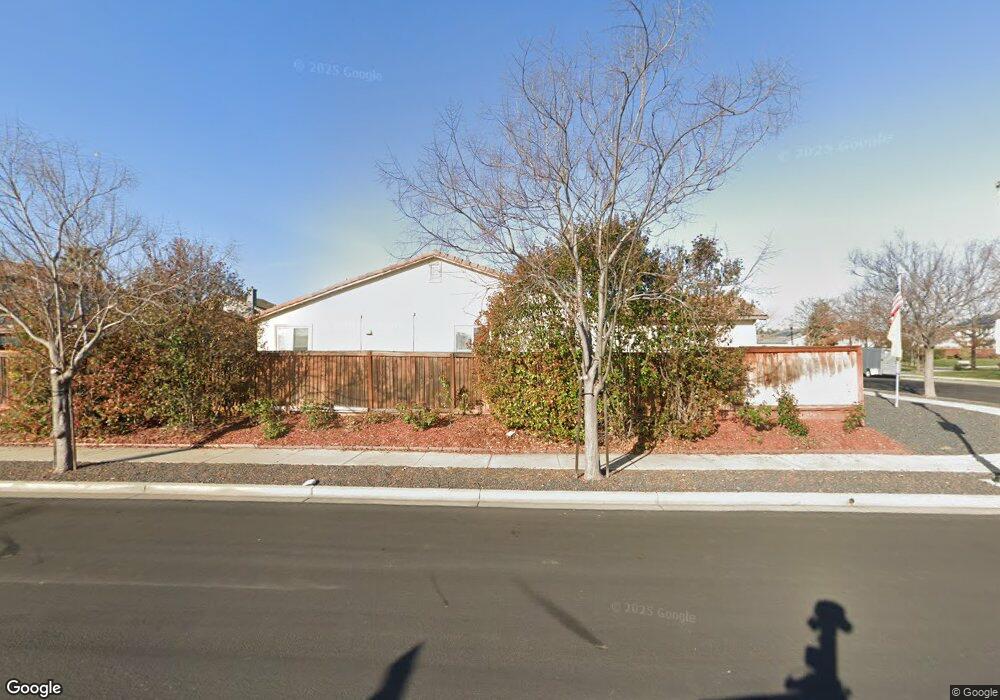
618 Eileen St Brentwood, CA 94513
Brentwood Center NeighborhoodEstimated Value: $753,000 - $876,000
3
Beds
3
Baths
2,398
Sq Ft
$346/Sq Ft
Est. Value
About This Home
This home is located at 618 Eileen St, Brentwood, CA 94513 and is currently estimated at $828,949, approximately $345 per square foot. 618 Eileen St is a home located in Contra Costa County with nearby schools including Mary Casey Black Elementary School, Edna Hill Middle School, and Liberty High School.
Ownership History
Date
Name
Owned For
Owner Type
Purchase Details
Closed on
Apr 5, 2011
Sold by
Western Pacific Housing Inc
Bought by
Formicola Robert A
Current Estimated Value
Home Financials for this Owner
Home Financials are based on the most recent Mortgage that was taken out on this home.
Original Mortgage
$325,384
Outstanding Balance
$223,644
Interest Rate
4.72%
Mortgage Type
VA
Estimated Equity
$605,305
Purchase Details
Closed on
Mar 21, 2011
Sold by
Formicola Cindy
Bought by
Formicola Robert A
Home Financials for this Owner
Home Financials are based on the most recent Mortgage that was taken out on this home.
Original Mortgage
$325,384
Outstanding Balance
$223,644
Interest Rate
4.72%
Mortgage Type
VA
Estimated Equity
$605,305
Create a Home Valuation Report for This Property
The Home Valuation Report is an in-depth analysis detailing your home's value as well as a comparison with similar homes in the area
Home Values in the Area
Average Home Value in this Area
Purchase History
| Date | Buyer | Sale Price | Title Company |
|---|---|---|---|
| Formicola Robert A | $315,000 | Old Republic Title Company | |
| Formicola Robert A | -- | Old Republic Title Company |
Source: Public Records
Mortgage History
| Date | Status | Borrower | Loan Amount |
|---|---|---|---|
| Open | Formicola Robert A | $325,384 |
Source: Public Records
Tax History
| Year | Tax Paid | Tax Assessment Tax Assessment Total Assessment is a certain percentage of the fair market value that is determined by local assessors to be the total taxable value of land and additions on the property. | Land | Improvement |
|---|---|---|---|---|
| 2025 | $8,246 | $444,391 | $38,430 | $405,961 |
| 2024 | $7,841 | $435,678 | $37,677 | $398,001 |
| 2023 | $7,841 | $427,137 | $36,939 | $390,198 |
| 2022 | $7,618 | $418,763 | $36,215 | $382,548 |
| 2021 | $7,467 | $410,553 | $35,505 | $375,048 |
| 2019 | $7,504 | $398,377 | $34,452 | $363,925 |
| 2018 | $7,008 | $354,567 | $33,777 | $320,790 |
| 2017 | $6,913 | $347,615 | $33,115 | $314,500 |
| 2016 | $6,579 | $340,800 | $32,466 | $308,334 |
| 2015 | $6,621 | $335,682 | $31,979 | $303,703 |
| 2014 | $6,485 | $329,107 | $31,353 | $297,754 |
Source: Public Records
Map
Nearby Homes
- 733 Jennifer St
- 714 Jennifer St
- 922 Oxford Ln
- 907 Snapdragon Way
- 0 Oak St
- 529 Chestnut St
- 2650 Sellers Ave
- 209 Brush Creek Dr
- 489 Silverwood St
- 1396 Berry Ln
- 1384 Berry Ln
- 145 Broderick Dr
- 383 Stanwick St
- 607 Bristol Ct
- 85 Baird Cir
- 500 Trellis Way
- 1135 Riverbend Dr
- 320 Jefferson Dr
- 579 Ash St
- 8500 Brentwood Blvd
Your Personal Tour Guide
Ask me questions while you tour the home.