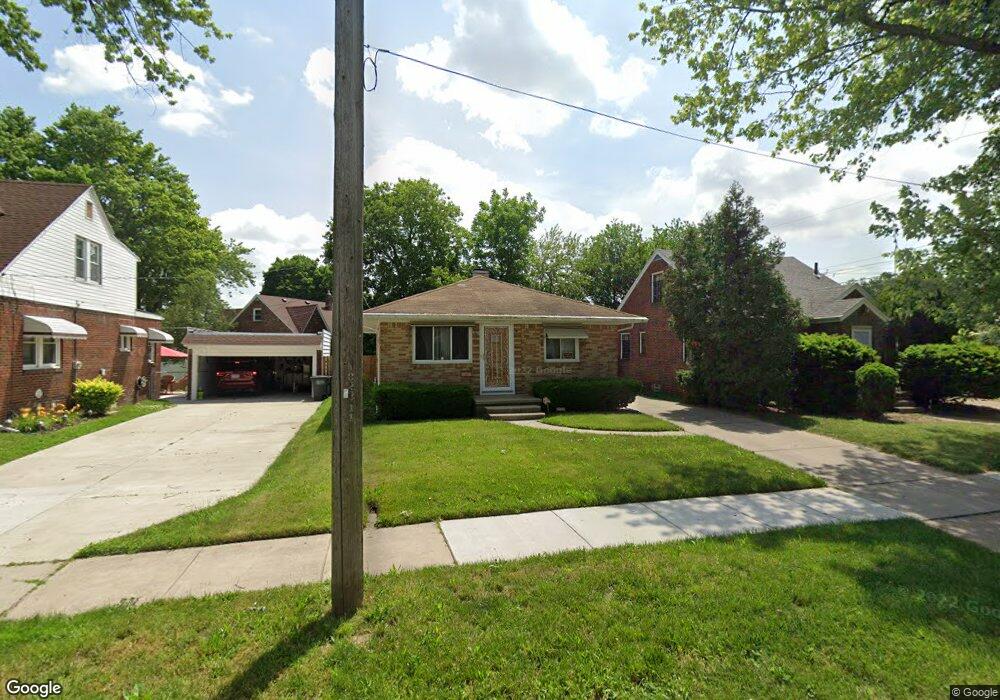
618 Falcon Rd Toledo, OH 43607
Scott Park NeighborhoodEstimated Value: $63,000 - $90,749
3
Beds
2
Baths
975
Sq Ft
$83/Sq Ft
Est. Value
About This Home
This home is located at 618 Falcon Rd, Toledo, OH 43607 and is currently estimated at $80,687, approximately $82 per square foot. 618 Falcon Rd is a home located in Lucas County with nearby schools including Jesup W. Scott High School, Explorers Academy, and Explorers Academy of Science and Technology.
Ownership History
Date
Name
Owned For
Owner Type
Purchase Details
Closed on
Oct 15, 2025
Sold by
Sheriff Of Lucas County
Bought by
Db Venture Management Llc
Current Estimated Value
Purchase Details
Closed on
Aug 10, 2020
Sold by
Madden Susan
Bought by
Shaw Cletissia J
Home Financials for this Owner
Home Financials are based on the most recent Mortgage that was taken out on this home.
Original Mortgage
$39,770
Interest Rate
3%
Mortgage Type
New Conventional
Purchase Details
Closed on
Jun 30, 2020
Sold by
Wofford Stephanie Lee and Maddox Stephanie Lee
Bought by
Madden Susan
Home Financials for this Owner
Home Financials are based on the most recent Mortgage that was taken out on this home.
Original Mortgage
$39,770
Interest Rate
3%
Mortgage Type
New Conventional
Purchase Details
Closed on
Sep 28, 2012
Sold by
Madden Susan
Bought by
Wofford Stephanie Lee and Mcnutt Stephanie L
Purchase Details
Closed on
Jul 1, 2011
Sold by
Estate Of Lillian R Raszka
Bought by
Madden Susan
Create a Home Valuation Report for This Property
The Home Valuation Report is an in-depth analysis detailing your home's value as well as a comparison with similar homes in the area
Home Values in the Area
Average Home Value in this Area
Purchase History
| Date | Buyer | Sale Price | Title Company |
|---|---|---|---|
| Db Venture Management Llc | $56,300 | None Listed On Document | |
| Shaw Cletissia J | $45,000 | None Available | |
| Madden Susan | -- | None Available | |
| Wofford Stephanie Lee | $65,000 | None Available | |
| Madden Susan | -- | None Available |
Source: Public Records
Mortgage History
| Date | Status | Borrower | Loan Amount |
|---|---|---|---|
| Previous Owner | Shaw Cletissia J | $39,770 |
Source: Public Records
Tax History
| Year | Tax Paid | Tax Assessment Tax Assessment Total Assessment is a certain percentage of the fair market value that is determined by local assessors to be the total taxable value of land and additions on the property. | Land | Improvement |
|---|---|---|---|---|
| 2025 | -- | $18,620 | $4,900 | $13,720 |
| 2024 | $615 | $18,620 | $4,900 | $13,720 |
| 2023 | $1,291 | $19,040 | $4,200 | $14,840 |
| 2022 | $1,275 | $19,040 | $4,200 | $14,840 |
| 2021 | $1,317 | $19,040 | $4,200 | $14,840 |
| 2020 | $1,265 | $15,925 | $3,465 | $12,460 |
| 2019 | $1,228 | $15,925 | $3,465 | $12,460 |
| 2018 | $1,240 | $15,925 | $3,465 | $12,460 |
| 2017 | $1,240 | $15,575 | $3,395 | $12,180 |
| 2016 | $2,591 | $44,500 | $9,700 | $34,800 |
| 2015 | $1,253 | $44,500 | $9,700 | $34,800 |
| 2014 | $1,470 | $15,580 | $3,400 | $12,180 |
| 2013 | $980 | $15,580 | $3,400 | $12,180 |
Source: Public Records
Map
Nearby Homes
- 811 N University Ave
- 824 N University Ave
- 913 Coventry Ave
- 336 Conrad Ave
- 508 Ascot Ave
- 1118 Alldays Ave
- 1206 Warwick Ave
- 605 Waverly Ave
- 616 Waverly Ave
- 933 Waverly Ave
- 2145 Dorr St
- 1215 Woodstock Ave
- 1004 Waverly Ave
- 1318 Addington Rd
- 2033 Crosswell Place
- 1675 Nebraska Ave
- 1424 Addington Rd
- 919 Turner Ave
- 2925 Avondale Ave
- 1652 Nebraska Ave
- 614 Falcon Rd
- 624 Falcon Rd
- 2235 Hinde Rd
- 2288 Nebraska Ave
- 630 Falcon Rd
- 2282 Nebraska Ave
- 2278 Nebraska Ave
- 617 Falcon Rd
- 613 Falcon Rd
- 621 Falcon Rd
- 2231 Hinde Rd
- 2302 Nebraska Ave
- 625 Falcon Rd
- 2274 Nebraska Ave
- 629 Falcon Rd
- 2308 Nebraska Ave
- 2270 Nebraska Ave
- 633 Falcon Rd
- 2312 Nebraska Ave
- 2242 Hinde Rd
Your Personal Tour Guide
Ask me questions while you tour the home.