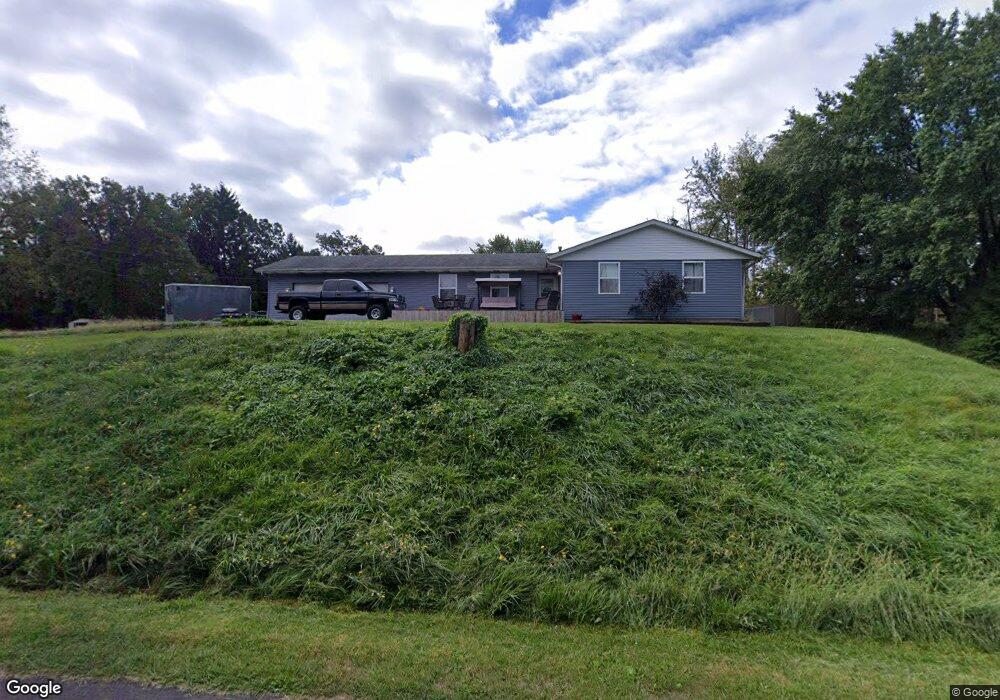
618 Hollywood Hebron, IN 46341
Porter County NeighborhoodEstimated Value: $260,000 - $306,000
4
Beds
2
Baths
1,530
Sq Ft
$181/Sq Ft
Est. Value
About This Home
This home is located at 618 Hollywood, Hebron, IN 46341 and is currently estimated at $276,588, approximately $180 per square foot. 618 Hollywood is a home located in Porter County with nearby schools including Porter Lakes Elementary School, Boone Grove Elementary School, and Boone Grove Middle School.
Ownership History
Date
Name
Owned For
Owner Type
Purchase Details
Closed on
May 9, 2016
Sold by
Pohlman Jeffrey A and Petkus Tammy
Bought by
Campagna Bryan and Campagna Tiffany
Current Estimated Value
Home Financials for this Owner
Home Financials are based on the most recent Mortgage that was taken out on this home.
Original Mortgage
$132,205
Outstanding Balance
$105,552
Interest Rate
3.75%
Mortgage Type
FHA
Estimated Equity
$171,036
Purchase Details
Closed on
Nov 21, 2007
Sold by
Deutsche Bank National Trust Co
Bought by
Pohlman Jeffrey A and Petkus Tammy
Home Financials for this Owner
Home Financials are based on the most recent Mortgage that was taken out on this home.
Original Mortgage
$90,900
Interest Rate
6.31%
Mortgage Type
Purchase Money Mortgage
Purchase Details
Closed on
Jul 11, 2007
Sold by
Hancock Lynn E
Bought by
Deutsche Bank National Trust Co and Certificateholdes Ffmlt05-Ff2
Create a Home Valuation Report for This Property
The Home Valuation Report is an in-depth analysis detailing your home's value as well as a comparison with similar homes in the area
Home Values in the Area
Average Home Value in this Area
Purchase History
| Date | Buyer | Sale Price | Title Company |
|---|---|---|---|
| Campagna Bryan | -- | Prism Title | |
| Pohlman Jeffrey A | -- | Investors Titlecorp | |
| Deutsche Bank National Trust Co | $119,250 | None Available |
Source: Public Records
Mortgage History
| Date | Status | Borrower | Loan Amount |
|---|---|---|---|
| Open | Campagna Bryan | $132,205 | |
| Previous Owner | Pohlman Jeffrey A | $90,900 |
Source: Public Records
Tax History Compared to Growth
Tax History
| Year | Tax Paid | Tax Assessment Tax Assessment Total Assessment is a certain percentage of the fair market value that is determined by local assessors to be the total taxable value of land and additions on the property. | Land | Improvement |
|---|---|---|---|---|
| 2024 | $1,580 | $235,400 | $29,000 | $206,400 |
| 2023 | $1,526 | $218,900 | $26,700 | $192,200 |
| 2022 | $1,526 | $199,600 | $26,700 | $172,900 |
| 2021 | $1,444 | $186,200 | $26,700 | $159,500 |
| 2020 | $1,133 | $162,500 | $23,000 | $139,500 |
| 2019 | $963 | $137,300 | $23,000 | $114,300 |
| 2018 | $914 | $131,600 | $23,000 | $108,600 |
| 2017 | $881 | $133,800 | $23,000 | $110,800 |
| 2016 | $922 | $141,900 | $32,700 | $109,200 |
| 2014 | $902 | $136,100 | $30,900 | $105,200 |
| 2013 | -- | $130,500 | $31,600 | $98,900 |
Source: Public Records
Map
Nearby Homes
- 46 S Delmar Ct
- N 675th W
- 545 W Fatima St
- 0 W Division (101st for Lake Co ) Rd W
- 83 Eskir Ln
- 763 Ketill Trace
- 767 Ketill Trace
- 707 Ketill Trail
- 84 Eskir Ln
- 91 Eskir Ln
- 732 Ketill Trace
- 708 Ketill Trace
- 764 Ketill Trace
- 709 Ketill Trail
- 700 W Bay Ct
- 710, 712, & 714 Ketill Trace
- 702 W Bay Ct
- 747 Ketill Trail
- 744 Ketill Ct
- 753 Ketill Trace