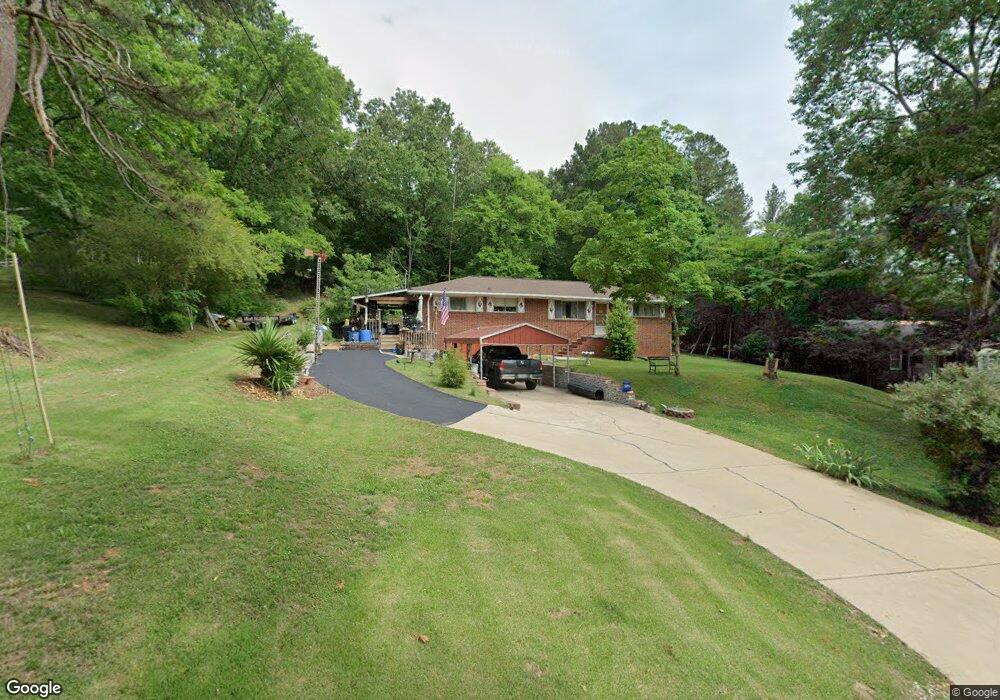
618 Layfield Rd Chattanooga, TN 37412
Estimated Value: $234,492 - $313,000
--
Bed
1
Bath
1,375
Sq Ft
$207/Sq Ft
Est. Value
About This Home
This home is located at 618 Layfield Rd, Chattanooga, TN 37412 and is currently estimated at $285,123, approximately $207 per square foot. 618 Layfield Rd is a home located in Hamilton County with nearby schools including Spring Creek Elementary School, East Ridge Middle School, and East Ridge High School.
Ownership History
Date
Name
Owned For
Owner Type
Purchase Details
Closed on
Jul 28, 2017
Sold by
Hunt Cynthia R
Bought by
Williams Michael S
Current Estimated Value
Purchase Details
Closed on
Jun 14, 2015
Sold by
Hunt Cynthia R
Bought by
Williams Michael S
Purchase Details
Closed on
Feb 19, 2011
Sold by
Starnes Barbara
Bought by
Hunt Cynthia R
Purchase Details
Closed on
Feb 1, 2011
Sold by
Bagley Wendy
Bought by
Hunt Cynthia R
Purchase Details
Closed on
Aug 31, 2009
Sold by
Hunt Cynthia R
Bought by
Bagley Wendy
Purchase Details
Closed on
Mar 25, 2008
Sold by
Williams Porter F and Bagley Wendy
Bought by
Starnes Barbara
Purchase Details
Closed on
Jan 10, 2007
Sold by
Slatton Virginia Lynn
Bought by
Williams Porter F and Hunt Cynthia R
Purchase Details
Closed on
May 24, 2006
Sold by
Slatton Virginia Lynn
Bought by
Williams Porter F and Hunt Cynthia R
Purchase Details
Closed on
Oct 1, 2003
Sold by
Williams Porter F
Bought by
Slatton Virginia Lynn
Create a Home Valuation Report for This Property
The Home Valuation Report is an in-depth analysis detailing your home's value as well as a comparison with similar homes in the area
Home Values in the Area
Average Home Value in this Area
Purchase History
| Date | Buyer | Sale Price | Title Company |
|---|---|---|---|
| Williams Michael S | -- | None Available | |
| Williams Michael S | -- | None Available | |
| Hunt Cynthia R | -- | None Available | |
| Hunt Cynthia R | -- | None Available | |
| Bagley Wendy | -- | None Available | |
| Starnes Barbara | -- | First Choice Title Inc | |
| Williams Porter F | -- | First Choice Title Inc | |
| Williams Porter F | -- | First Choice Title Inc | |
| Slatton Virginia Lynn | -- | First Choice Title Inc |
Source: Public Records
Tax History Compared to Growth
Tax History
| Year | Tax Paid | Tax Assessment Tax Assessment Total Assessment is a certain percentage of the fair market value that is determined by local assessors to be the total taxable value of land and additions on the property. | Land | Improvement |
|---|---|---|---|---|
| 2024 | $898 | $40,125 | $0 | $0 |
| 2023 | $1,408 | $40,125 | $0 | $0 |
| 2022 | $1,408 | $40,125 | $0 | $0 |
| 2021 | $1,588 | $40,125 | $0 | $0 |
| 2020 | $1,441 | $30,500 | $0 | $0 |
| 2019 | $1,441 | $30,500 | $0 | $0 |
| 2018 | $1,441 | $30,500 | $0 | $0 |
| 2017 | $1,441 | $30,500 | $0 | $0 |
| 2016 | $1,440 | $0 | $0 | $0 |
| 2015 | $1,440 | $29,875 | $0 | $0 |
| 2014 | $1,440 | $0 | $0 | $0 |
Source: Public Records
Map
Nearby Homes
- 7104 Moreview Rd
- 401 Pine Bluff Dr
- 6804 Satya Way
- 581 Benson Dr
- 6920 Wakerobin Dr
- 570 Shanti Dr
- 6690 Dharma Loop
- 6762 Dharma Loop
- 6714 Dharma Loop
- 6722 Dharma Loop
- 6787 Dharma Loop
- 574 Prema Dr
- 709 Haven Hill Dr
- 707 Haven Hill Dr
- 6430 Dharma Loop
- 707 & 709 Haven Hill Dr
- 6667 Dharma Loop
- 707709 Haven Hill Dr
- 551 Prema Dr
- 6682 Dharma Loop
- 622 Layfield Rd
- 612 Layfield Rd
- 7006 Moreview Rd
- 7010 Moreview Rd
- 619 Layfield Rd
- 604 Layfield Rd
- 605 Layfield Rd
- 7008 Moreview Rd
- 7008 Moreview Rd Unit 1
- 614 Frawley Rd
- 7101 Tanager Ct
- 603 Layfield Rd
- 7012 Moreview Rd
- 7012 Moreview Rd Unit 1
- 600 Layfield Rd
- 7100 Tanager Ct
- 618 Frawley Rd
- 7102 Moreview Rd
- 7114 Tanager Ct
- 547 Benson Dr