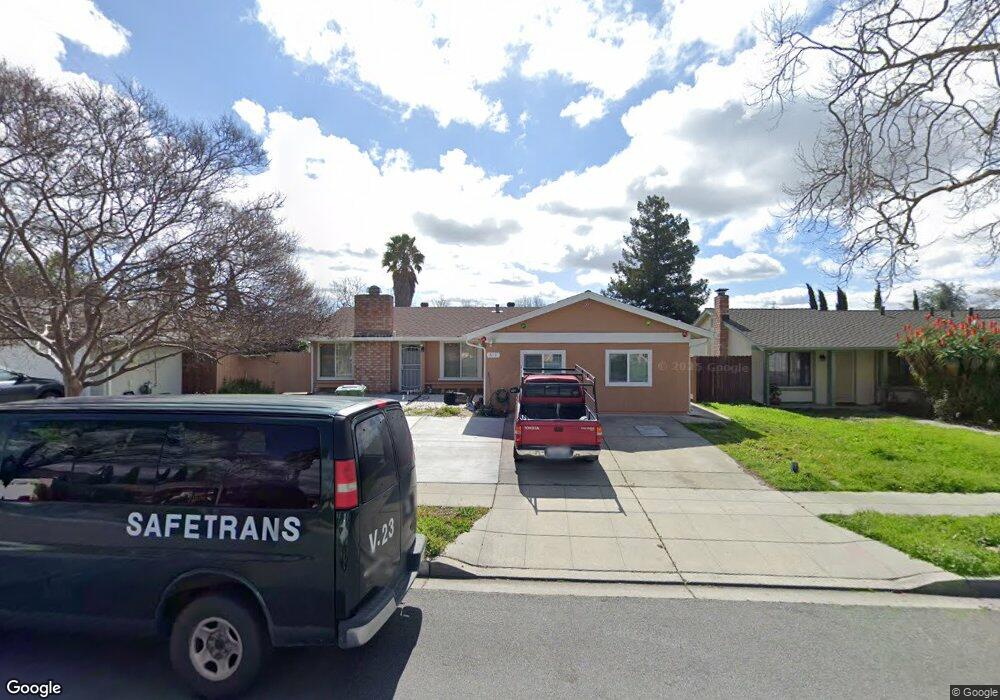
618 Manzano St Milpitas, CA 95035
Estimated Value: $1,553,367 - $1,764,000
4
Beds
3
Baths
1,054
Sq Ft
$1,565/Sq Ft
Est. Value
About This Home
This home is located at 618 Manzano St, Milpitas, CA 95035 and is currently estimated at $1,649,342, approximately $1,564 per square foot. 618 Manzano St is a home located in Santa Clara County with nearby schools including Marshall Pomeroy Elementary School, Thomas Russell Middle School, and Milpitas High School.
Ownership History
Date
Name
Owned For
Owner Type
Purchase Details
Closed on
Nov 19, 2002
Sold by
Tran Tai V
Bought by
Tran Tai and Nguyen Thuy T
Current Estimated Value
Home Financials for this Owner
Home Financials are based on the most recent Mortgage that was taken out on this home.
Original Mortgage
$280,000
Outstanding Balance
$118,142
Interest Rate
6.12%
Estimated Equity
$1,531,200
Purchase Details
Closed on
Oct 25, 1999
Sold by
Nguyen Thuy Thanh
Bought by
Vanvantran Tai Van
Home Financials for this Owner
Home Financials are based on the most recent Mortgage that was taken out on this home.
Original Mortgage
$240,000
Interest Rate
7.82%
Purchase Details
Closed on
Oct 14, 1999
Sold by
Somani Basant K
Bought by
Tran Tai
Home Financials for this Owner
Home Financials are based on the most recent Mortgage that was taken out on this home.
Original Mortgage
$240,000
Interest Rate
7.82%
Create a Home Valuation Report for This Property
The Home Valuation Report is an in-depth analysis detailing your home's value as well as a comparison with similar homes in the area
Home Values in the Area
Average Home Value in this Area
Purchase History
We collect this data history from publicly available records. To have your information removed, we recommend requesting removal directly through your county’s website.
| Date | Buyer | Sale Price | Title Company |
|---|---|---|---|
| Tran Tai | -- | Fidelity National Title Ins | |
| Vanvantran Tai Van | -- | Financial Title Company | |
| Tran Tai | $310,000 | Financial Title Company |
Source: Public Records
Mortgage History
We collect this data history from publicly available records. To have your information removed, we recommend requesting removal directly through your county’s website.
| Date | Status | Borrower | Loan Amount |
|---|---|---|---|
| Open | Tran Tai | $280,000 | |
| Closed | Tran Tai | $240,000 |
Source: Public Records
Tax History
| Year | Tax Paid | Tax Assessment Tax Assessment Total Assessment is a certain percentage of the fair market value that is determined by local assessors to be the total taxable value of land and additions on the property. | Land | Improvement |
|---|---|---|---|---|
| 2025 | $7,165 | $622,523 | $215,170 | $407,353 |
| 2024 | $7,165 | $610,317 | $210,951 | $399,366 |
| 2023 | $7,141 | $598,351 | $206,815 | $391,536 |
| 2022 | $7,112 | $586,619 | $202,760 | $383,859 |
| 2021 | $7,008 | $575,118 | $198,785 | $376,333 |
| 2020 | $6,886 | $569,222 | $196,747 | $372,475 |
| 2019 | $6,072 | $496,062 | $192,890 | $303,172 |
| 2018 | $5,296 | $445,159 | $189,108 | $256,051 |
| 2017 | $5,227 | $436,431 | $185,400 | $251,031 |
| 2016 | $5,013 | $427,874 | $181,765 | $246,109 |
| 2015 | $4,962 | $421,448 | $179,035 | $242,413 |
| 2014 | $4,821 | $413,193 | $175,528 | $237,665 |
Source: Public Records
Map
Nearby Homes
- 448 Greathouse Dr
- 62 Washington Square Dr
- 108 Arbor Way
- 106 Sunnyhills Ct
- 668 Erie Cir
- 642 Aberdeen Way
- 239 Balboa Dr
- 1321 Terra Vista Ct
- 545 Printy Ave
- 60 Wilson Way Unit 4
- 60 Wilson Way Unit 104
- 60 Wilson Way Unit 35
- 60 Wilson Way Unit 117
- 2000 Scott Creek Rd
- 49002 Cinnamon Fern Common Unit 507
- 1402 Stemel Way
- 1199 N Abbott Ave
- 48962 Woodgrove Common
- 587 Chardonnay Dr
- 408 Desert Holly St
- 608 Manzano St
- 628 Manzano St
- 1375 Cirolero St
- 598 Manzano St
- 1363 Cirolero St
- 621 Manzano St
- 611 Manzano St
- 631 Manzano St
- 588 Manzano St
- 601 Manzano St
- 1351 Cirolero St
- 641 Manzano Ct
- 1400 Cirolero St
- 1390 Cirolero St
- 1380 Cirolero St
- 1370 Cirolero St
- 1354 Higuera Place
- 591 Manzano St
- 578 Manzano St
- 1348 Higuera Place
Your Personal Tour Guide
Ask me questions while you tour the home.