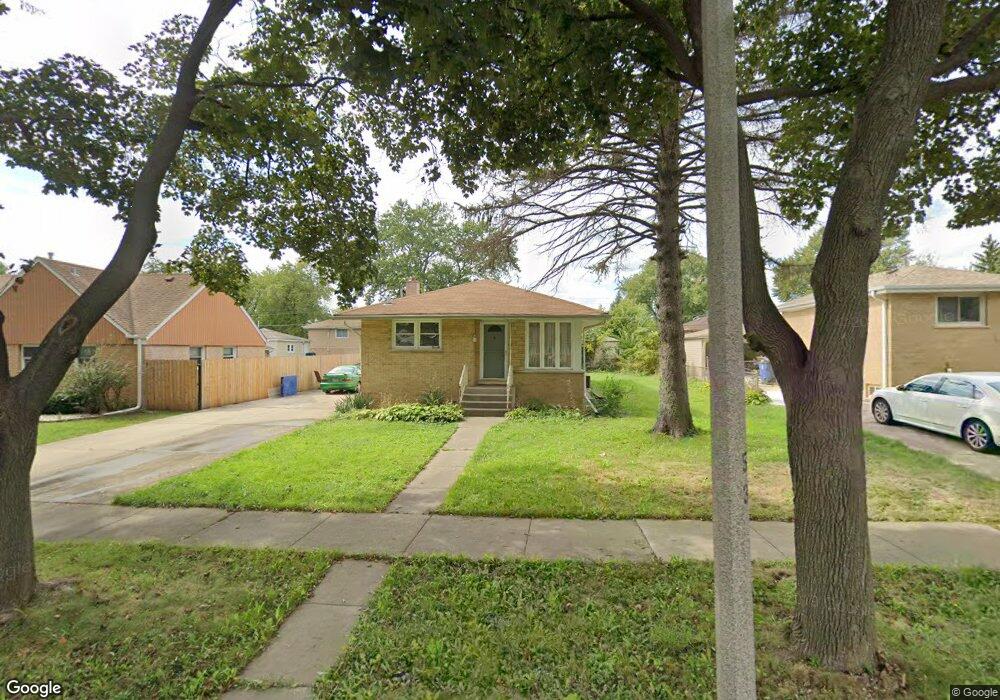
618 N Neva Ave Addison, IL 60101
Estimated Value: $296,128 - $361,000
Studio
--
Bath
1,100
Sq Ft
$311/Sq Ft
Est. Value
About This Home
This home is located at 618 N Neva Ave, Addison, IL 60101 and is currently estimated at $341,782, approximately $310 per square foot. 618 N Neva Ave is a home located in DuPage County with nearby schools including Lincoln Elementary School, Indian Trail Jr High School, and Addison Trail High School.
Ownership History
Date
Name
Owned For
Owner Type
Purchase Details
Closed on
Jun 5, 2012
Sold by
Colon Luis and Colon Agniezka
Bought by
Colon Agniezka
Current Estimated Value
Home Financials for this Owner
Home Financials are based on the most recent Mortgage that was taken out on this home.
Original Mortgage
$138,200
Outstanding Balance
$93,731
Interest Rate
3.38%
Mortgage Type
New Conventional
Estimated Equity
$248,051
Purchase Details
Closed on
Jun 15, 2001
Sold by
Crawford Jason C and Crawford Kelly A
Bought by
Colon Luis and Colon Agnieszka
Home Financials for this Owner
Home Financials are based on the most recent Mortgage that was taken out on this home.
Original Mortgage
$160,550
Interest Rate
7.16%
Purchase Details
Closed on
Mar 27, 1998
Sold by
Madalinski William P and Madalinski Kathleen R
Bought by
Crawford Jason C and Crawford Kelly A
Home Financials for this Owner
Home Financials are based on the most recent Mortgage that was taken out on this home.
Original Mortgage
$106,800
Interest Rate
7.27%
Create a Home Valuation Report for This Property
The Home Valuation Report is an in-depth analysis detailing your home's value as well as a comparison with similar homes in the area
Home Values in the Area
Average Home Value in this Area
Purchase History
| Date | Buyer | Sale Price | Title Company |
|---|---|---|---|
| Colon Agniezka | -- | None Available | |
| Colon Luis | $169,000 | -- | |
| Crawford Jason C | $133,333 | -- |
Source: Public Records
Mortgage History
| Date | Status | Borrower | Loan Amount |
|---|---|---|---|
| Open | Colon Agniezka | $138,200 | |
| Closed | Colon Luis | $160,550 | |
| Previous Owner | Crawford Jason C | $106,800 |
Source: Public Records
Tax History
| Year | Tax Paid | Tax Assessment Tax Assessment Total Assessment is a certain percentage of the fair market value that is determined by local assessors to be the total taxable value of land and additions on the property. | Land | Improvement |
|---|---|---|---|---|
| 2024 | $6,185 | $95,749 | $41,141 | $54,608 |
| 2023 | $5,891 | $88,020 | $37,820 | $50,200 |
| 2022 | $5,483 | $80,450 | $34,530 | $45,920 |
| 2021 | $5,248 | $77,050 | $33,070 | $43,980 |
| 2020 | $5,100 | $73,810 | $31,680 | $42,130 |
| 2019 | $5,059 | $70,970 | $30,460 | $40,510 |
| 2018 | $4,997 | $67,550 | $28,990 | $38,560 |
| 2017 | $4,861 | $64,560 | $27,710 | $36,850 |
| 2016 | $4,717 | $59,600 | $25,580 | $34,020 |
| 2015 | $4,586 | $55,060 | $23,630 | $31,430 |
| 2014 | $4,541 | $54,260 | $21,660 | $32,600 |
| 2013 | $4,451 | $55,360 | $22,100 | $33,260 |
Source: Public Records
Map
Nearby Homes
- 138 W Janice Ln
- 734 N Briar Hill Ln Unit 3
- 720 N Briar Hill Ln Unit 5
- 730 N Briar Hill Ln Unit 1
- 724 N Briar Hill Ln Unit 3
- 710 N Briar Hill Ln Unit 5
- 235 N Mill Rd Unit 115B
- 245 N Mill Rd Unit 9C
- 387 Masters Dr
- 539 W Eggerding Dr
- 330 Masters Dr
- 981 N Mill Rd Unit 1
- 276 Masters Dr
- 257 Masters Dr
- 427 W Natoma Ave
- 6238 Links Dr Unit 4001
- 253 Masters Dr
- 4N163 5th Ave
- 542 W Memory Ln
- 551 N 6th Ave
- 624 N Neva Ave
- 614 N Neva Ave
- 619 N Craig Place
- 606 N Neva Ave
- 623 N Craig Place
- 613 N Craig Place
- 630 N Neva Ave
- 615 N Neva Ave
- 611 N Neva Ave
- 621 N Neva Ave
- 607 N Craig Place
- 627 N Craig Place
- 627 N Neva Ave
- 636 N Neva Ave
- 602 N Neva Ave
- 605 N Neva Ave
- 633 N Craig Place
- 631 N Neva Ave
- 601 N Neva Ave
- 638 N Neva Ave
Your Personal Tour Guide
Ask me questions while you tour the home.