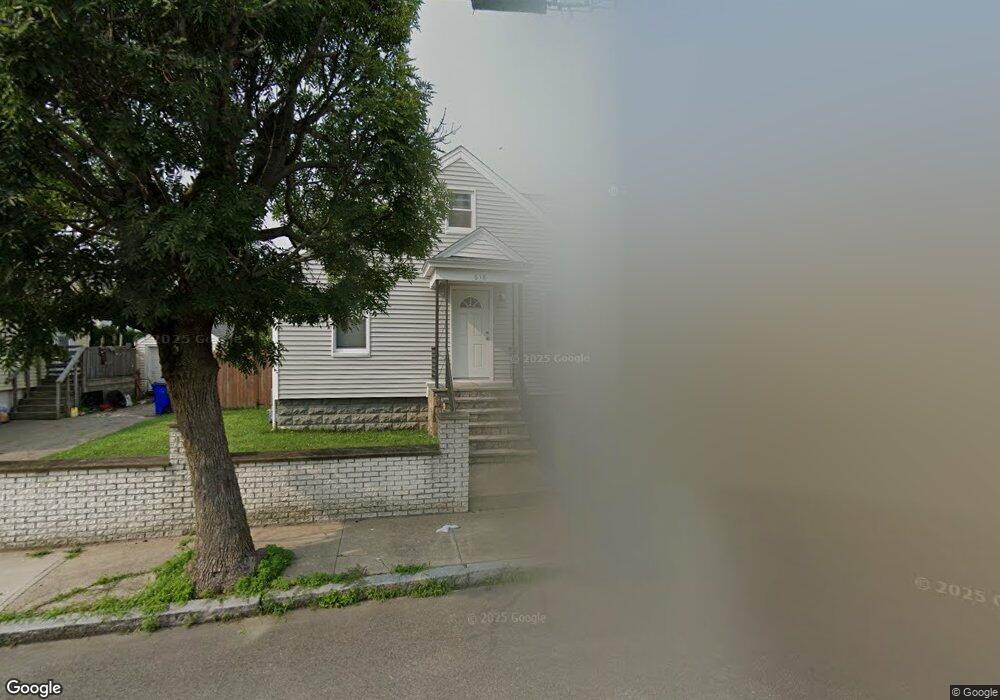
618 Pokross St Fall River, MA 02724
Sandy Beach NeighborhoodEstimated Value: $423,000 - $553,000
3
Beds
2
Baths
2,371
Sq Ft
$200/Sq Ft
Est. Value
About This Home
This home is located at 618 Pokross St, Fall River, MA 02724 and is currently estimated at $474,729, approximately $200 per square foot. 618 Pokross St is a home located in Bristol County with nearby schools including Carlton M. Viveiros Elementary School, Matthew J. Kuss Middle School, and B M C Durfee High School.
Ownership History
Date
Name
Owned For
Owner Type
Purchase Details
Closed on
Nov 30, 2016
Sold by
Leite Jason C
Bought by
Assonet Realty Llc
Current Estimated Value
Home Financials for this Owner
Home Financials are based on the most recent Mortgage that was taken out on this home.
Original Mortgage
$145,000
Outstanding Balance
$116,465
Interest Rate
3.52%
Mortgage Type
New Conventional
Estimated Equity
$358,264
Purchase Details
Closed on
Mar 1, 2001
Sold by
Desilva Constantino T and Desilva Gorette
Bought by
Leite Jason C and Marcoux Jennifer L
Purchase Details
Closed on
Apr 30, 1998
Sold by
Cranshaw Gertrude
Bought by
Desilva Constantino T and Desilva Gorette
Create a Home Valuation Report for This Property
The Home Valuation Report is an in-depth analysis detailing your home's value as well as a comparison with similar homes in the area
Home Values in the Area
Average Home Value in this Area
Purchase History
| Date | Buyer | Sale Price | Title Company |
|---|---|---|---|
| Assonet Realty Llc | $90,001 | -- | |
| Leite Jason C | $131,000 | -- | |
| Desilva Constantino T | $110,000 | -- |
Source: Public Records
Mortgage History
| Date | Status | Borrower | Loan Amount |
|---|---|---|---|
| Open | Assonet Realty Llc | $145,000 | |
| Previous Owner | Desilva Constantino T | $189,000 | |
| Previous Owner | Desilva Constantino T | $153,000 |
Source: Public Records
Tax History
| Year | Tax Paid | Tax Assessment Tax Assessment Total Assessment is a certain percentage of the fair market value that is determined by local assessors to be the total taxable value of land and additions on the property. | Land | Improvement |
|---|---|---|---|---|
| 2025 | $4,377 | $382,300 | $115,600 | $266,700 |
| 2024 | $4,151 | $361,300 | $113,400 | $247,900 |
| 2023 | $3,955 | $322,300 | $102,100 | $220,200 |
| 2022 | $3,708 | $293,800 | $96,400 | $197,400 |
| 2021 | $3,246 | $245,000 | $92,100 | $152,900 |
| 2020 | $3,179 | $269,500 | $87,900 | $181,600 |
| 2019 | $3,805 | $261,000 | $91,800 | $169,200 |
| 2018 | $3,556 | $243,200 | $92,500 | $150,700 |
| 2017 | $3,388 | $242,000 | $92,500 | $149,500 |
| 2016 | $3,244 | $238,000 | $95,300 | $142,700 |
| 2015 | $3,342 | $255,500 | $95,300 | $160,200 |
| 2014 | $3,214 | $255,500 | $95,300 | $160,200 |
Source: Public Records
Map
Nearby Homes
- 616 Woodman St
- 126 Wheeler St
- 609 King Philip St
- 2229 S Main St
- 15 Higgins St
- 464 Birch St
- 57 Larouche St
- 1852 S Main St
- 1846 S Main St
- 245 Dwelly St
- 24 Valley St
- 579 Summit St Unit 3
- 579 Summit St Unit 2
- 30 Broad St
- 234 Kilburn St
- 917 Dwelly St
- 391 Clarkson St
- 20 Wilcox St
- 42 Main Rd
- 1334 S Main St
- 606 Pokross St
- 632 Pokross St
- 619 Hicks St
- 611 Hicks St
- 644 Pokross St
- 629 Hicks St
- 596 Pokross St
- 615 Pokross St
- 593 Hicks St
- 631 Pokross St
- 637 Hicks St Unit 639
- 597 Pokross St
- 643 Pokross St
- 580 Pokross St
- 577 Hicks St Unit 579
- 699 King St
- 577-579 Hicks St
- 589 Pokross St
- 671 King St
- 222 Walter St
Your Personal Tour Guide
Ask me questions while you tour the home.