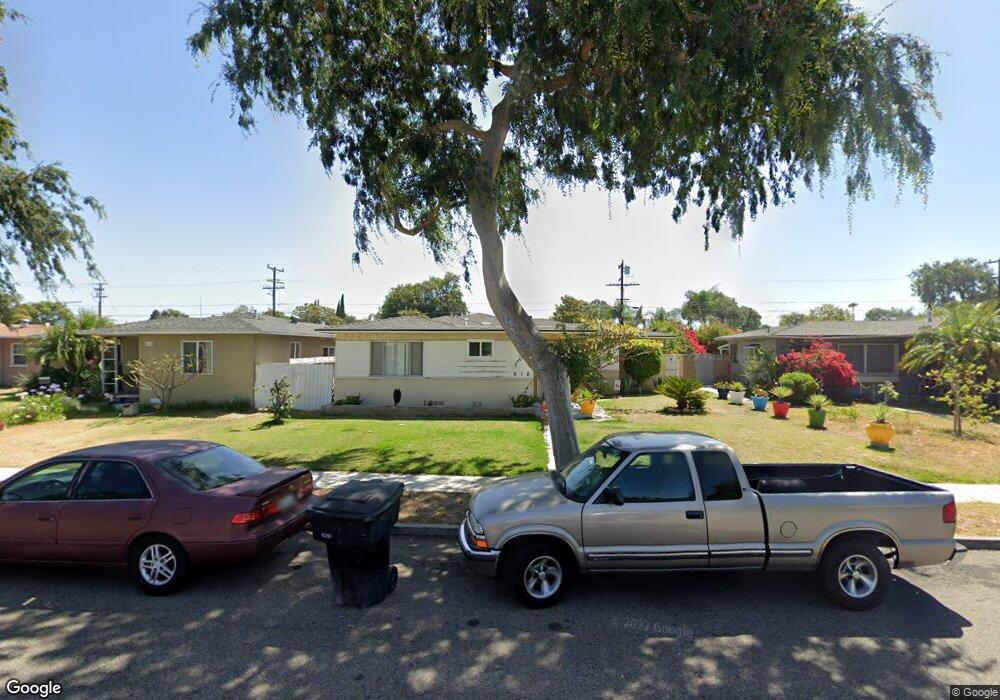
618 S Resh St Anaheim, CA 92805
The Colony NeighborhoodEstimated Value: $838,000 - $1,001,000
3
Beds
2
Baths
1,568
Sq Ft
$578/Sq Ft
Est. Value
About This Home
This home is located at 618 S Resh St, Anaheim, CA 92805 and is currently estimated at $906,112, approximately $577 per square foot. 618 S Resh St is a home located in Orange County with nearby schools including Benjamin Franklin Elementary School, Sycamore Junior High School, and Anaheim High School.
Ownership History
Date
Name
Owned For
Owner Type
Purchase Details
Closed on
Jan 29, 2009
Sold by
Martinez Haro Leonel
Bought by
Martinez Haro Leonel and Martinez Veronica
Current Estimated Value
Home Financials for this Owner
Home Financials are based on the most recent Mortgage that was taken out on this home.
Original Mortgage
$253,000
Outstanding Balance
$159,413
Interest Rate
5.04%
Mortgage Type
New Conventional
Estimated Equity
$746,700
Purchase Details
Closed on
May 2, 2002
Sold by
Martinez Veronica
Bought by
Martinez Haro Leonel
Home Financials for this Owner
Home Financials are based on the most recent Mortgage that was taken out on this home.
Original Mortgage
$254,013
Interest Rate
7.13%
Mortgage Type
FHA
Purchase Details
Closed on
Mar 8, 1999
Sold by
Acosta Hector V
Bought by
Ruiz Leandro and Ruiz Arturo
Create a Home Valuation Report for This Property
The Home Valuation Report is an in-depth analysis detailing your home's value as well as a comparison with similar homes in the area
Home Values in the Area
Average Home Value in this Area
Purchase History
| Date | Buyer | Sale Price | Title Company |
|---|---|---|---|
| Martinez Haro Leonel | -- | Ticor Title | |
| Martinez Haro Leonel | -- | South Coast Title Company | |
| Martinez Haro Leonel | $258,000 | South Coast Title Company | |
| Ruiz Leandro | -- | -- |
Source: Public Records
Mortgage History
| Date | Status | Borrower | Loan Amount |
|---|---|---|---|
| Open | Martinez Haro Leonel | $253,000 | |
| Closed | Martinez Haro Leonel | $254,013 |
Source: Public Records
Tax History Compared to Growth
Tax History
| Year | Tax Paid | Tax Assessment Tax Assessment Total Assessment is a certain percentage of the fair market value that is determined by local assessors to be the total taxable value of land and additions on the property. | Land | Improvement |
|---|---|---|---|---|
| 2025 | $4,497 | $381,135 | $292,910 | $88,225 |
| 2024 | $4,497 | $373,662 | $287,166 | $86,496 |
| 2023 | $4,402 | $366,336 | $281,536 | $84,800 |
| 2022 | $4,346 | $359,153 | $276,015 | $83,138 |
| 2021 | $4,352 | $352,111 | $270,603 | $81,508 |
| 2020 | $4,334 | $348,501 | $267,828 | $80,673 |
| 2019 | $4,207 | $341,668 | $262,576 | $79,092 |
| 2018 | $4,121 | $334,969 | $257,427 | $77,542 |
| 2017 | $3,960 | $328,401 | $252,379 | $76,022 |
| 2016 | $3,949 | $321,962 | $247,430 | $74,532 |
| 2015 | $3,914 | $317,126 | $243,713 | $73,413 |
| 2014 | $3,675 | $310,914 | $238,939 | $71,975 |
Source: Public Records
Map
Nearby Homes
- 526 W Water St
- 719 S Pine St
- 701 W Provential Dr
- 523 S Citron St
- 609 S Helena St
- 628 S Clementine St
- 833 S Lemon St
- 615 S Hazelwood St
- 1131 W Beacon Ave
- 616 S Boxwood St
- 1028 S Citron St Unit 16
- 951 S Citron St Unit 5
- 967 S Citron St Unit 3
- 713 S Anaheim Blvd
- 208 S Illinois St
- 1124 S Citron St Unit 85
- 435 W Center Street Promenade Unit 331
- 435 W Center Street Promenade Unit 401
- 435 W Center Street Promenade Unit 400
- 1136 W Broadway