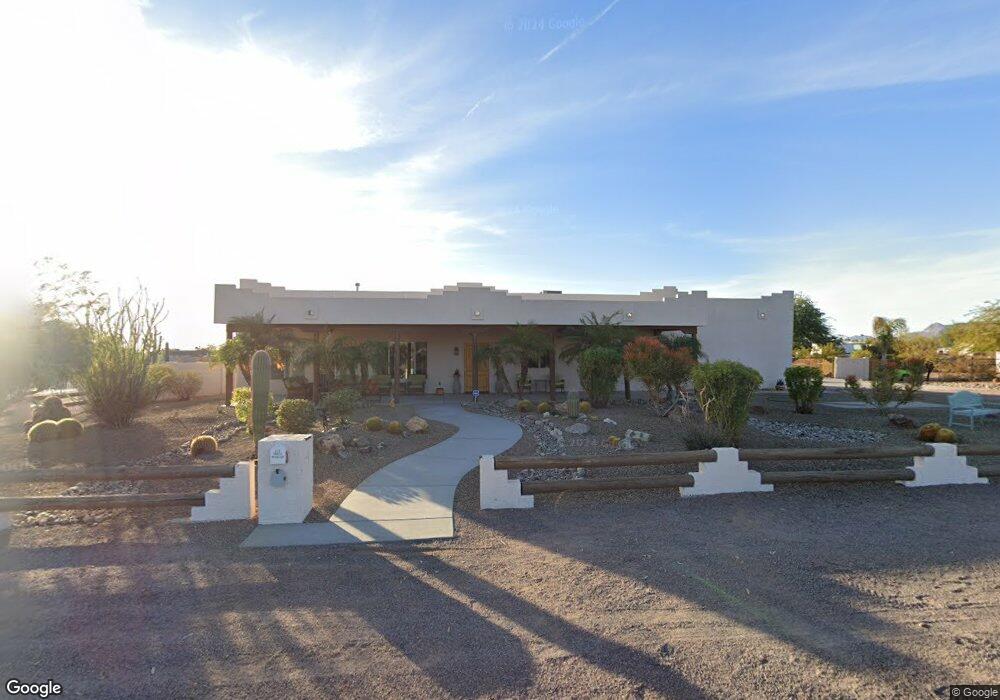
618 S Wickiup Rd Apache Junction, AZ 85119
Estimated Value: $706,000 - $789,000
4
Beds
3
Baths
2,606
Sq Ft
$285/Sq Ft
Est. Value
About This Home
This home is located at 618 S Wickiup Rd, Apache Junction, AZ 85119 and is currently estimated at $742,516, approximately $284 per square foot. 618 S Wickiup Rd is a home located in Pinal County with nearby schools including Desert Vista Elementary School, Cactus Canyon Junior High School, and Apache Junction High School.
Ownership History
Date
Name
Owned For
Owner Type
Purchase Details
Closed on
Mar 14, 2011
Sold by
Kondaur Capital Corporation
Bought by
Seger Geir and Seger Janette E
Current Estimated Value
Home Financials for this Owner
Home Financials are based on the most recent Mortgage that was taken out on this home.
Original Mortgage
$192,200
Outstanding Balance
$8,931
Interest Rate
4.9%
Mortgage Type
New Conventional
Estimated Equity
$733,585
Purchase Details
Closed on
Jan 5, 2010
Sold by
Mckinney James H
Bought by
Kondaur Capital Corporation
Purchase Details
Closed on
Jan 9, 2007
Sold by
Essary Hollis Edward and Essary Linda Ruth
Bought by
Mckinney James H
Create a Home Valuation Report for This Property
The Home Valuation Report is an in-depth analysis detailing your home's value as well as a comparison with similar homes in the area
Home Values in the Area
Average Home Value in this Area
Purchase History
| Date | Buyer | Sale Price | Title Company |
|---|---|---|---|
| Seger Geir | $240,250 | First American Title Ins Co | |
| Kondaur Capital Corporation | $389,000 | Security Title Agency | |
| Mckinney James H | -- | None Available |
Source: Public Records
Mortgage History
| Date | Status | Borrower | Loan Amount |
|---|---|---|---|
| Open | Seger Geir | $192,200 |
Source: Public Records
Tax History
| Year | Tax Paid | Tax Assessment Tax Assessment Total Assessment is a certain percentage of the fair market value that is determined by local assessors to be the total taxable value of land and additions on the property. | Land | Improvement |
|---|---|---|---|---|
| 2025 | $3,323 | $62,091 | -- | -- |
| 2024 | $3,122 | $64,715 | -- | -- |
| 2023 | $3,269 | $55,473 | $10,457 | $45,016 |
| 2022 | $3,122 | $39,798 | $6,253 | $33,545 |
| 2021 | $3,221 | $36,004 | $0 | $0 |
| 2020 | $3,141 | $34,643 | $0 | $0 |
| 2019 | $3,006 | $30,065 | $0 | $0 |
| 2018 | $2,940 | $27,755 | $0 | $0 |
| 2017 | $2,866 | $25,768 | $0 | $0 |
| 2016 | $2,778 | $26,021 | $3,655 | $22,366 |
| 2014 | $2,096 | $13,735 | $2,665 | $11,070 |
Source: Public Records
Map
Nearby Homes
- 0 E Broadway Avenue Lot 1 --
- 522 S Cortez Rd
- 1371 E 4th Ave Unit 85
- 1371 E 4th Ave Unit 75
- 0 S Cortez Rd Unit A
- 0 N Cortez Rd Unit LOT 1 6888157
- 1470 S Bowman Rd
- 1050 E Broadway Ave Unit 15
- 1483 S Tomahawk Rd Unit 27A
- 1453 E Old West Hwy
- 1955 E Old Hwy W Unit 2
- 980 E Broadway Ave Unit 17
- 250 N Tomahawk Rd Unit 1
- 1616 S Aryelle Rd
- 385 N Tomahawk Rd
- 880 S Royal Palm Rd Unit LOT 1
- 1038 E Friar Ave
- 1336 S Cactus Rd
- 1415 S Havasupai Dr Unit 415
- 1325 S Starr Rd
- 662 S Wickiup Rd
- 700 S Wickiup Rd
- 700 S Wickiup Rd Unit 11
- 700 S Wickiup Rd
- 663 S Wickiup Rd
- 555 S Wickiup Rd
- 611 S Vista Rd
- 525 S Vista Rd
- 461 S Wickiup Rd
- 775 S Vista Rd
- 775 S Vista Rd Unit na
- 1917 E 4th Ave
- 2000 E Broadway Ave
- 2000 E Broadway Ave
- 457 S Vista Rd
- 612 S Vista Rd
- 578 S Vista Rd
- 750 S Vista Rd
- 1921 E Broadway Ave
- 1921 E Broadway Ave
Your Personal Tour Guide
Ask me questions while you tour the home.