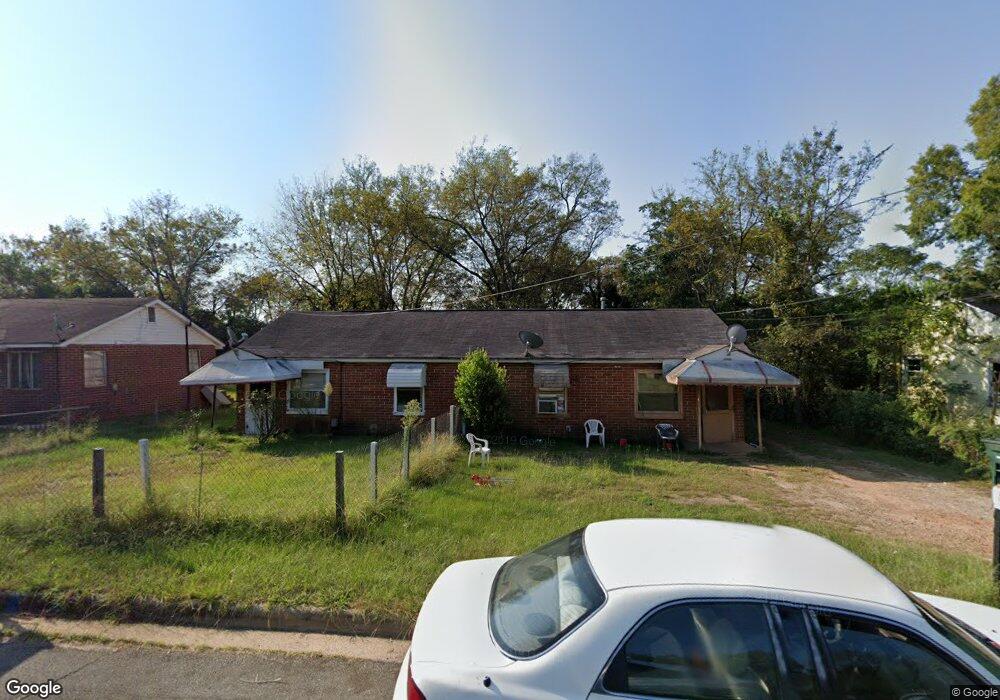
618 Shi Place Unit 618-620 Macon, GA 31206
Estimated Value: $75,051 - $102,000
4
Beds
2
Baths
1,592
Sq Ft
$57/Sq Ft
Est. Value
About This Home
This home is located at 618 Shi Place Unit 618-620, Macon, GA 31206 and is currently estimated at $90,763, approximately $57 per square foot. 618 Shi Place Unit 618-620 is a home located in Bibb County with nearby schools including Bruce Elementary School, Rutland Middle School, and Rutland High School.
Ownership History
Date
Name
Owned For
Owner Type
Purchase Details
Closed on
Sep 6, 2023
Sold by
Donahue & Landers Llc
Bought by
Thomas Barry and Thomas Shacara
Current Estimated Value
Home Financials for this Owner
Home Financials are based on the most recent Mortgage that was taken out on this home.
Original Mortgage
$64,400
Outstanding Balance
$62,869
Interest Rate
6.81%
Mortgage Type
New Conventional
Estimated Equity
$27,894
Purchase Details
Closed on
Dec 16, 2020
Sold by
Homeclub Llc
Bought by
Donahue & Landers Llc
Purchase Details
Closed on
Jul 26, 2019
Sold by
Cobb Payton Claude C and Cobb Payton Sr Claude
Bought by
Homeclub Llc
Purchase Details
Closed on
May 2, 2019
Sold by
Payton Lucile W
Bought by
Cobb Payton Claude C and Cobb Payton Sr Clauude
Purchase Details
Closed on
Sep 23, 1968
Sold by
Rita Wm N and Rita Arnold
Bought by
Payton Claude C - Lucile W
Create a Home Valuation Report for This Property
The Home Valuation Report is an in-depth analysis detailing your home's value as well as a comparison with similar homes in the area
Home Values in the Area
Average Home Value in this Area
Purchase History
| Date | Buyer | Sale Price | Title Company |
|---|---|---|---|
| Thomas Barry | $80,500 | None Listed On Document | |
| Donahue & Landers Llc | $18,250 | Burgess Title & Escrow Llc | |
| Homeclub Llc | $7,750 | None Available | |
| Cobb Payton Claude C | -- | None Available | |
| Payton Claude C - Lucile W | $100 | -- |
Source: Public Records
Mortgage History
| Date | Status | Borrower | Loan Amount |
|---|---|---|---|
| Open | Thomas Barry | $64,400 |
Source: Public Records
Tax History Compared to Growth
Tax History
| Year | Tax Paid | Tax Assessment Tax Assessment Total Assessment is a certain percentage of the fair market value that is determined by local assessors to be the total taxable value of land and additions on the property. | Land | Improvement |
|---|---|---|---|---|
| 2025 | $631 | $25,695 | $2,800 | $22,895 |
| 2024 | $653 | $25,695 | $2,800 | $22,895 |
| 2023 | $507 | $19,971 | $2,800 | $17,171 |
| 2022 | $664 | $19,171 | $2,032 | $17,139 |
| 2021 | $277 | $7,300 | $866 | $6,434 |
| 2020 | $120 | $11,670 | $1,386 | $10,284 |
| 2019 | $479 | $12,224 | $1,108 | $11,116 |
| 2018 | $1,093 | $12,224 | $1,108 | $11,116 |
| 2017 | $458 | $12,224 | $1,108 | $11,116 |
| 2016 | $423 | $12,224 | $1,108 | $11,116 |
| 2015 | $599 | $12,224 | $1,108 | $11,116 |
| 2014 | $745 | $13,234 | $1,108 | $12,126 |
Source: Public Records
Map
Nearby Homes
- 4249 Trammel Ave
- 4283 Irving Ave
- 4268 Marion Ave
- 4305 Marion Ave
- 4054 Marion Ave
- 4189 Marion Ave
- 4255 Worsham Ave
- 4319 Worsham Ave
- 4298 Worsham Ave
- 110 Debbie Ct
- 4378 Mikado Ave
- 4386 Mikado Ave
- 4030 Marion Ave
- 912 Thomas St
- 4409 Mikado Ave
- 4235 Mikado Ave
- 4062 Broadway
- 562 Richmond St
- 935 Troupe St
- 567 Richmond St