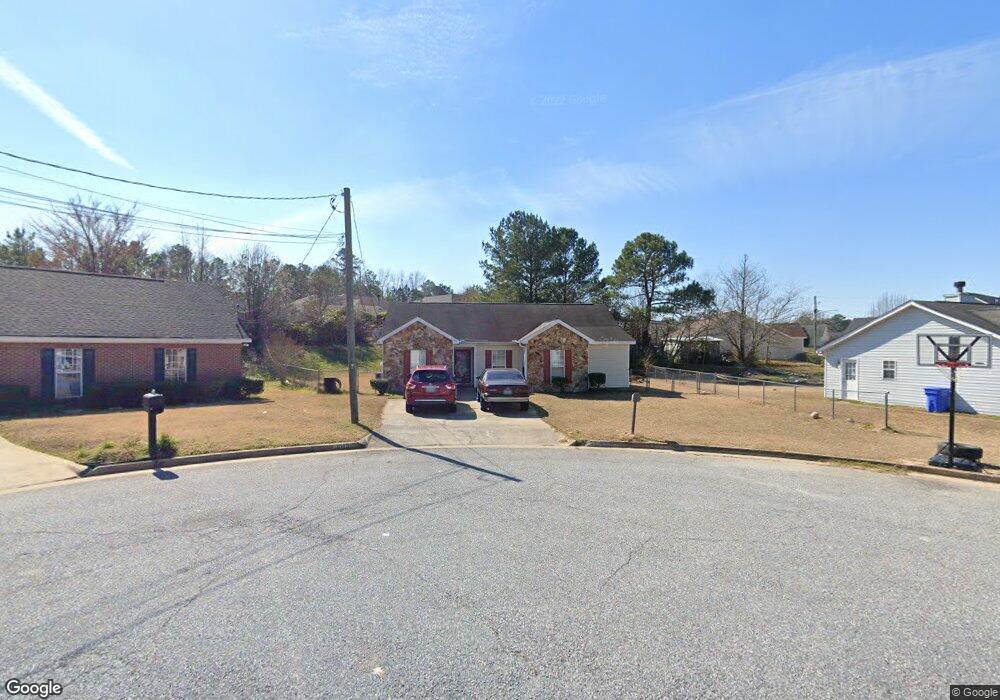
6182 Quail Ct Columbus, GA 31907
Eastern Columbus NeighborhoodEstimated Value: $153,000 - $173,000
3
Beds
3
Baths
1,410
Sq Ft
$118/Sq Ft
Est. Value
About This Home
This home is located at 6182 Quail Ct, Columbus, GA 31907 and is currently estimated at $166,672, approximately $118 per square foot. 6182 Quail Ct is a home located in Muscogee County with nearby schools including Wesley Heights Elementary School, Fort Middle School, and Kendrick High School.
Ownership History
Date
Name
Owned For
Owner Type
Purchase Details
Closed on
Feb 8, 2010
Sold by
Wachovia Mortgage Corporation
Bought by
Eleby Quentin M
Current Estimated Value
Home Financials for this Owner
Home Financials are based on the most recent Mortgage that was taken out on this home.
Original Mortgage
$97,280
Outstanding Balance
$64,286
Interest Rate
5%
Mortgage Type
VA
Estimated Equity
$102,386
Purchase Details
Closed on
Nov 30, 2009
Sold by
Federal National Mortgage Association
Bought by
Wachovia Mortgage Corporation
Purchase Details
Closed on
Aug 5, 2008
Sold by
Wachovia Mortgage Corp
Bought by
Federal National Mortgage Association
Purchase Details
Closed on
Apr 25, 2007
Sold by
Browder Tyrone W
Bought by
Wood Tilena S
Home Financials for this Owner
Home Financials are based on the most recent Mortgage that was taken out on this home.
Original Mortgage
$119,900
Interest Rate
6.1%
Mortgage Type
Purchase Money Mortgage
Create a Home Valuation Report for This Property
The Home Valuation Report is an in-depth analysis detailing your home's value as well as a comparison with similar homes in the area
Home Values in the Area
Average Home Value in this Area
Purchase History
| Date | Buyer | Sale Price | Title Company |
|---|---|---|---|
| Eleby Quentin M | $95,000 | None Available | |
| Wachovia Mortgage Corporation | -- | None Available | |
| Federal National Mortgage Association | -- | None Available | |
| Wachovia Mortgage Corp | $125,739 | None Available | |
| Wood Tilena S | $119,900 | None Available |
Source: Public Records
Mortgage History
| Date | Status | Borrower | Loan Amount |
|---|---|---|---|
| Open | Eleby Quentin M | $97,280 | |
| Previous Owner | Wood Tilena S | $119,900 |
Source: Public Records
Tax History Compared to Growth
Tax History
| Year | Tax Paid | Tax Assessment Tax Assessment Total Assessment is a certain percentage of the fair market value that is determined by local assessors to be the total taxable value of land and additions on the property. | Land | Improvement |
|---|---|---|---|---|
| 2025 | $971 | $57,016 | $8,848 | $48,168 |
| 2024 | $970 | $57,016 | $8,848 | $48,168 |
| 2023 | $282 | $57,016 | $8,848 | $48,168 |
| 2022 | $1,012 | $41,940 | $8,848 | $33,092 |
| 2021 | $1,005 | $35,632 | $8,848 | $26,784 |
| 2020 | $1,005 | $35,632 | $8,848 | $26,784 |
| 2019 | $1,010 | $35,632 | $8,848 | $26,784 |
| 2018 | $1,010 | $35,632 | $8,848 | $26,784 |
| 2017 | $1,015 | $35,632 | $8,848 | $26,784 |
| 2016 | $1,020 | $47,557 | $6,177 | $41,380 |
| 2015 | $1,022 | $47,557 | $6,177 | $41,380 |
| 2014 | $1,025 | $47,557 | $6,177 | $41,380 |
| 2013 | -- | $47,557 | $6,177 | $41,380 |
Source: Public Records
Map
Nearby Homes
- 1754 Mazor Dr
- 6916 Bradshaw Dr
- 1925 Woodhollow Dr
- 6213 Fitzgerald Dr
- 1826 Woodhollow Dr
- 1607 Mazor Dr
- 5929 Gleneden Dr
- 5920 Gleneden Dr
- 2525 Corineth Dr
- 2672 Honeysuckle Dr
- 6032 Cordova Rd
- 2708 Courtland Ave
- 5833 Gleneden Dr
- 6047 Capri Cir
- 6059 Nassau Cir
- 1322 Melford Dr
- 5906 Forrest Rd
- 6033 Luna Dr
- 6061 Luna Dr
- 6028 Caribou Dr
- 6176 Quail Ct
- 6188 Quail Ct
- 6081 Hunter Ridge Cir
- 6093 Creekside Dr
- 6085 Hunter Ridge Cir
- 6091 Creekside Dr
- 6077 Hunter Ridge Cir
- 6089 Hunter Ridge Cir
- 6194 Quail Ct
- 0 Hunter Ridge Cir
- 6200 Quail Ct
- 6093 Hunter Ridge Cir
- 6073 Hunter Ridge Cir
- 6087 Creekside Dr
- 6195 Quail Ct
- 6189 Quail Ct
- 6080 Creekside Dr
- 6181 Quail Ct
- 6175 Quail Ct
- 6097 Hunter Ridge Cir