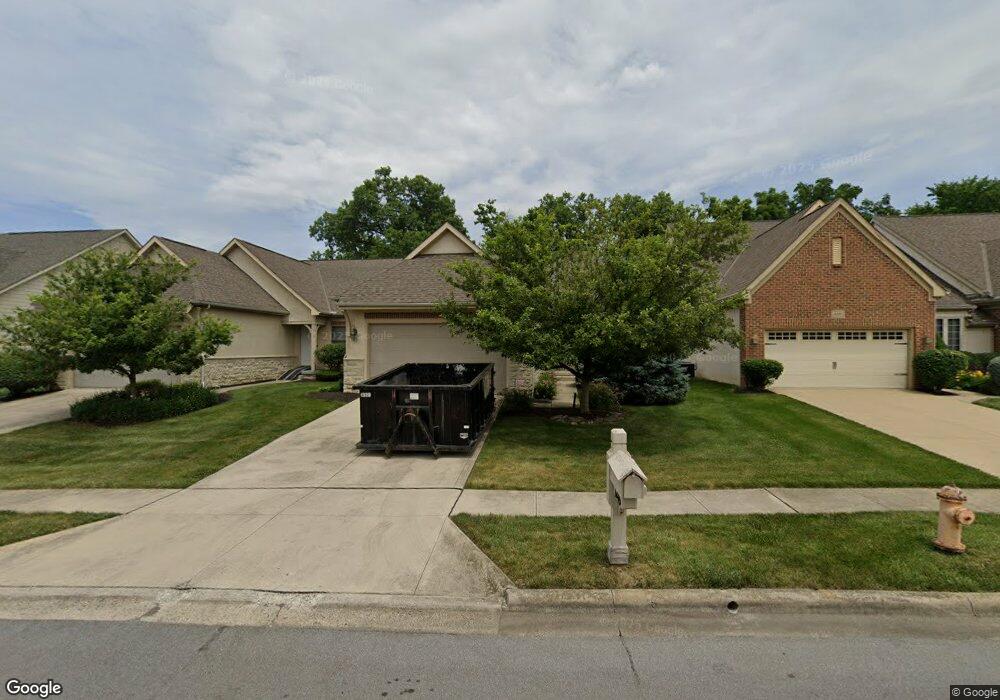
6186 Kinver Edge Way Unit 3b Columbus, OH 43213
Olde Orchard NeighborhoodEstimated Value: $394,507 - $658,000
3
Beds
3
Baths
2,000
Sq Ft
$243/Sq Ft
Est. Value
About This Home
This home is located at 6186 Kinver Edge Way Unit 3b, Columbus, OH 43213 and is currently estimated at $486,127, approximately $243 per square foot. 6186 Kinver Edge Way Unit 3b is a home located in Franklin County with nearby schools including Waggoner Road Elementary School, Waggoner Road Junior High School, and Holy Spirit School.
Ownership History
Date
Name
Owned For
Owner Type
Purchase Details
Closed on
Oct 6, 2014
Sold by
Denis King Investments Llc
Bought by
Parms John and Branch Parms Crystal
Current Estimated Value
Home Financials for this Owner
Home Financials are based on the most recent Mortgage that was taken out on this home.
Original Mortgage
$199,900
Outstanding Balance
$153,196
Interest Rate
4.09%
Mortgage Type
New Conventional
Estimated Equity
$332,931
Purchase Details
Closed on
Feb 28, 2012
Sold by
Cugini & Capoccia Builders Inc
Bought by
Denis King Investments Llc
Home Financials for this Owner
Home Financials are based on the most recent Mortgage that was taken out on this home.
Original Mortgage
$3,218,000
Interest Rate
3.86%
Mortgage Type
Future Advance Clause Open End Mortgage
Create a Home Valuation Report for This Property
The Home Valuation Report is an in-depth analysis detailing your home's value as well as a comparison with similar homes in the area
Home Values in the Area
Average Home Value in this Area
Purchase History
| Date | Buyer | Sale Price | Title Company |
|---|---|---|---|
| Parms John | $249,900 | Peak Title | |
| Denis King Investments Llc | -- | Bxpeak Title |
Source: Public Records
Mortgage History
| Date | Status | Borrower | Loan Amount |
|---|---|---|---|
| Open | Parms John | $199,900 | |
| Previous Owner | Denis King Investments Llc | $3,218,000 |
Source: Public Records
Tax History Compared to Growth
Tax History
| Year | Tax Paid | Tax Assessment Tax Assessment Total Assessment is a certain percentage of the fair market value that is determined by local assessors to be the total taxable value of land and additions on the property. | Land | Improvement |
|---|---|---|---|---|
| 2024 | $4,786 | $117,500 | $30,910 | $86,590 |
| 2023 | $4,712 | $117,495 | $30,905 | $86,590 |
| 2022 | $4,099 | $80,440 | $14,320 | $66,120 |
| 2021 | $4,111 | $80,440 | $14,320 | $66,120 |
| 2020 | $4,156 | $80,440 | $14,320 | $66,120 |
| 2019 | $3,983 | $67,030 | $11,940 | $55,090 |
| 2018 | $4,764 | $67,030 | $11,940 | $55,090 |
| 2017 | $4,765 | $67,030 | $11,940 | $55,090 |
| 2016 | $5,549 | $83,620 | $11,940 | $71,680 |
| 2015 | $5,547 | $83,620 | $11,940 | $71,680 |
| 2014 | $5,738 | $83,620 | $11,940 | $71,680 |
| 2013 | $2,935 | $88,025 | $12,565 | $75,460 |
Source: Public Records
Map
Nearby Homes
- 187 McNaughten Rd
- 6193 Stornoway Dr S Unit 6193
- 6198 Stornoway Dr S Unit 6198
- 85 Stornoway Dr W Unit 85
- 117 Stornoway Dr E
- 6056 Naughten Pond Dr
- 6052 Naughten Pond Dr
- 6040 Naughten Pond Dr
- Oxford Plan at Icon Villas at McNaughten
- Ashton Plan at Icon Villas at McNaughten
- 541 Woodingham Place Unit 2-C
- 557 Woodingham Place Unit 1A
- 6279 Braiden Ct Unit 10B
- 6033 McNaughten Grove Ln
- 5850 Forestview Dr
- 6560 Schenk Ave
- 147 Shadymere Ln Unit 5
- 6610 Olivetree Ct
- 142 Villamere Dr Unit 6
- 6258 Peach Tree Rd
- 6186 Kinver Edge Way
- 6180 Kinver Edge Way
- 6192 Kinver Edge Way
- 6192 Kinver Edge Way Unit 4A
- 6174 Kinver Edge Way
- 6198 Kinver Edge Way
- 6198 Kinver Edge Way Unit 4B
- 6178 Kinver Edge Way
- 6168 Kinver Edge Way
- 6204 Kinver Edge Way
- 6162 Kinver Edge Way
- 6210 Kinver Edge Way
- 6187 Kinver Edge Way
- 6193 Kinver Edge Way
- 6181 Kinver Edge Way
- 266 McNaughten Rd
- 6199 Kinver Edge Way
- 6205 Kinver Edge Way
- 6175 Kinver Edge Way
- 6175 Kinver Edge Way Unit 28 a