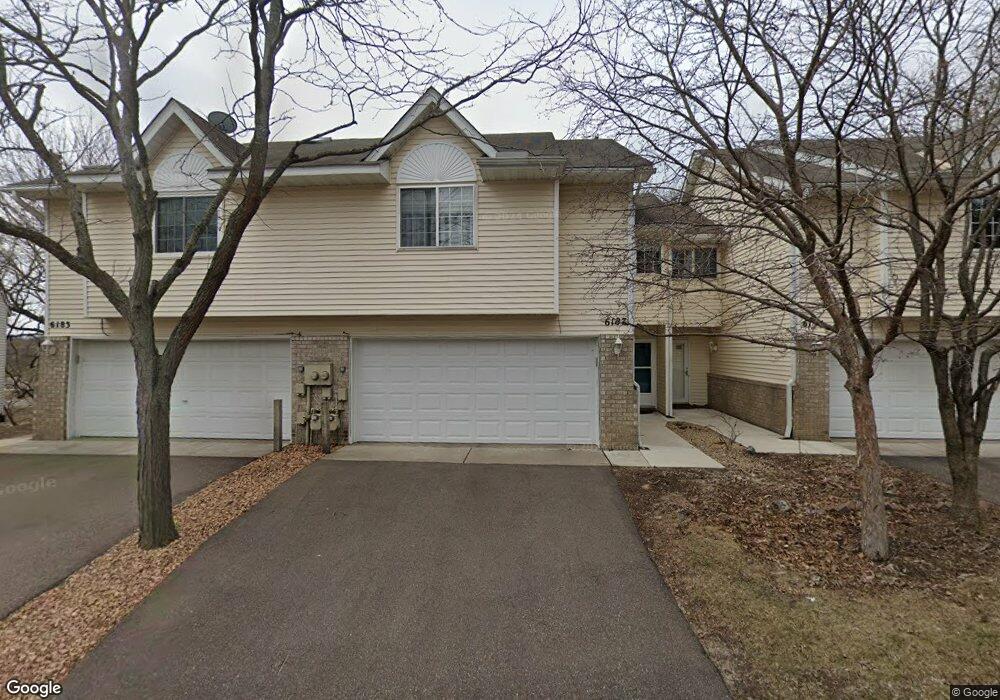
6187 Creek Line Dr Minnetonka, MN 55345
Estimated Value: $339,000 - $383,000
3
Beds
2
Baths
1,113
Sq Ft
$323/Sq Ft
Est. Value
About This Home
This home is located at 6187 Creek Line Dr, Minnetonka, MN 55345 and is currently estimated at $359,019, approximately $322 per square foot. 6187 Creek Line Dr is a home located in Hennepin County with nearby schools including Clear Springs Elementary School, Minnetonka West Middle School, and Minnetonka Senior High School.
Ownership History
Date
Name
Owned For
Owner Type
Purchase Details
Closed on
May 15, 2015
Sold by
Crayne Ryan K
Bought by
Hocevar Ronda J
Current Estimated Value
Home Financials for this Owner
Home Financials are based on the most recent Mortgage that was taken out on this home.
Original Mortgage
$217,979
Outstanding Balance
$166,014
Interest Rate
3.37%
Mortgage Type
FHA
Estimated Equity
$193,005
Purchase Details
Closed on
Nov 1, 2010
Sold by
Scarseth Michael T and Scarseth Sarah J
Bought by
Crayne Ryan K
Purchase Details
Closed on
Aug 6, 2004
Sold by
Wilson Christopher M and Wilson Joan Elizabeth
Bought by
Scarseth Michael T and Scarseth Sarah J
Purchase Details
Closed on
Aug 15, 2000
Sold by
Boerger Hiroko J
Bought by
Wilson Christopher M
Purchase Details
Closed on
May 15, 1998
Sold by
Carew Jones Rodney and Carew Jones Lesa
Bought by
Boerger Hiroko J
Purchase Details
Closed on
Apr 6, 1996
Sold by
Sunset Homes Cor
Bought by
Carew-Jones Rodney D
Create a Home Valuation Report for This Property
The Home Valuation Report is an in-depth analysis detailing your home's value as well as a comparison with similar homes in the area
Home Values in the Area
Average Home Value in this Area
Purchase History
| Date | Buyer | Sale Price | Title Company |
|---|---|---|---|
| Hocevar Ronda J | $222,000 | Burnet Title | |
| Crayne Ryan K | $209,900 | -- | |
| Scarseth Michael T | $245,000 | -- | |
| Wilson Christopher M | $200,000 | -- | |
| Boerger Hiroko J | $164,000 | -- | |
| Carew-Jones Rodney D | $159,900 | -- |
Source: Public Records
Mortgage History
| Date | Status | Borrower | Loan Amount |
|---|---|---|---|
| Open | Hocevar Ronda J | $217,979 |
Source: Public Records
Tax History Compared to Growth
Tax History
| Year | Tax Paid | Tax Assessment Tax Assessment Total Assessment is a certain percentage of the fair market value that is determined by local assessors to be the total taxable value of land and additions on the property. | Land | Improvement |
|---|---|---|---|---|
| 2024 | $4,302 | $338,700 | $60,500 | $278,200 |
| 2023 | $4,068 | $330,900 | $60,500 | $270,400 |
| 2022 | $3,723 | $297,000 | $60,500 | $236,500 |
| 2021 | $3,556 | $279,400 | $55,000 | $224,400 |
| 2020 | $3,480 | $268,600 | $55,000 | $213,600 |
| 2019 | $3,281 | $253,300 | $55,000 | $198,300 |
| 2018 | $3,039 | $239,300 | $55,000 | $184,300 |
| 2017 | $2,979 | $217,600 | $40,000 | $177,600 |
| 2016 | $2,892 | $211,400 | $40,000 | $171,400 |
| 2015 | -- | $204,300 | $30,000 | $174,300 |
| 2014 | -- | $204,300 | $30,000 | $174,300 |
Source: Public Records
Map
Nearby Homes
- 18130 Covington Path
- 5980 Covington Terrace
- 18502 Apple Tree Ct
- 18863 Broadmoore Dr
- 5534 Conifer Trail
- 5826 Salisbury Ave
- 6281 Whispering Oaks Dr
- 6285 Duck Lake Rd
- 19500 Silver Lake Trail
- 17110 Claycross Way
- 5800 Scenic Heights Dr
- 16816 Excelsior Blvd
- The Leo Plan at The Enclave - The Legacy Collection
- The Edgestone Plan at The Enclave - The Legacy Collection
- 16680 N Manor Rd
- 16695 S Manor Rd
- 450 Indian Hill Rd
- 17238 Millwood Rd
- 460 Indian Hill Rd
- 16651 S Manor Rd
- 6191 Creek Line Dr
- 6183 Creek Line Dr
- 6195 Creek Line Dr
- 6179 Creek Line Dr
- 6175 Creek Line Dr
- 6171 Creek Line Dr
- 6116 Creek Line Dr
- 6112 Creek Line Dr
- 6120 Creek Line Dr
- 6163 Creek Line Dr
- 6108 Creek Line Dr
- 6159 Creek Line Dr
- 6104 Creek Line Dr
- 18309 Creeks Bend Dr
- 18315 Creeks Bend Dr
- 6155 Creek Line Dr
- 6100 Creek Line Dr
- 18319 Creeks Bend Dr
- 6151 Creek Line Dr
- 6115 Creek Line Dr