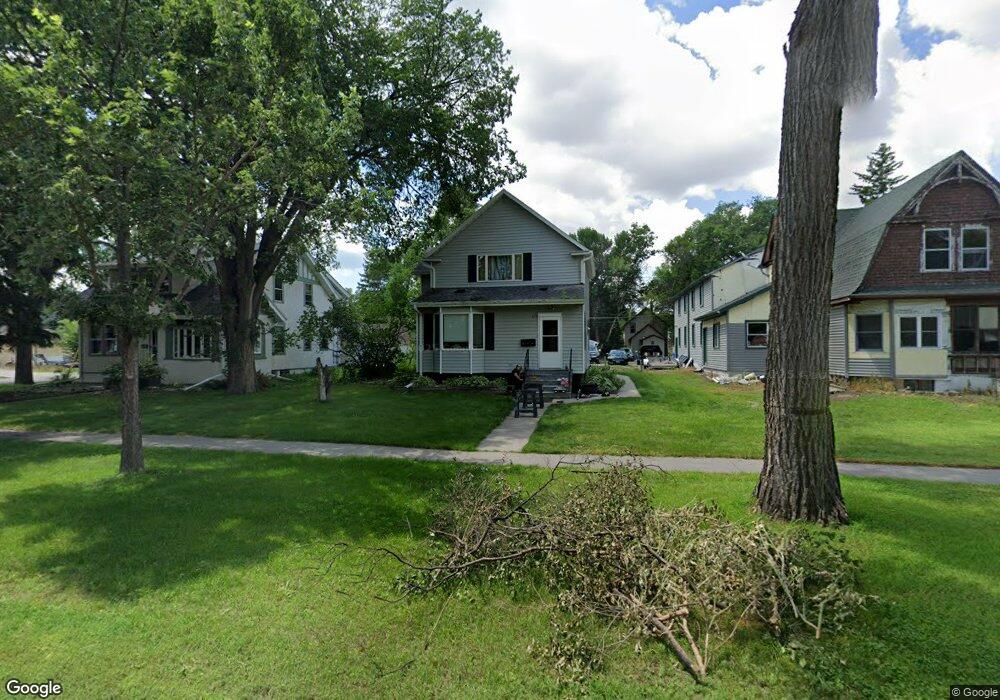
619 10th St S Fargo, ND 58103
Hawthorne NeighborhoodEstimated Value: $229,000 - $270,000
--
Bed
--
Bath
1,970
Sq Ft
$122/Sq Ft
Est. Value
About This Home
This home is located at 619 10th St S, Fargo, ND 58103 and is currently estimated at $240,823, approximately $122 per square foot. 619 10th St S is a home located in Cass County with nearby schools including Clara Barton Elementary School, Ben Franklin Middle School, and South High School.
Ownership History
Date
Name
Owned For
Owner Type
Purchase Details
Closed on
Aug 30, 2021
Sold by
Marcuson Mitchell R and Marcuson Eileen M
Bought by
Marcuson Brett Ryan
Current Estimated Value
Home Financials for this Owner
Home Financials are based on the most recent Mortgage that was taken out on this home.
Original Mortgage
$140,000
Outstanding Balance
$127,199
Interest Rate
2.7%
Mortgage Type
New Conventional
Estimated Equity
$113,624
Purchase Details
Closed on
Mar 31, 2000
Sold by
Marcuson Shane R
Bought by
Marcuson Mitchell R and Marcuson Eileen M
Create a Home Valuation Report for This Property
The Home Valuation Report is an in-depth analysis detailing your home's value as well as a comparison with similar homes in the area
Home Values in the Area
Average Home Value in this Area
Purchase History
| Date | Buyer | Sale Price | Title Company |
|---|---|---|---|
| Marcuson Brett Ryan | $175,000 | Fm Title | |
| Marcuson Mitchell R | -- | None Available |
Source: Public Records
Mortgage History
| Date | Status | Borrower | Loan Amount |
|---|---|---|---|
| Open | Marcuson Brett Ryan | $140,000 |
Source: Public Records
Tax History Compared to Growth
Tax History
| Year | Tax Paid | Tax Assessment Tax Assessment Total Assessment is a certain percentage of the fair market value that is determined by local assessors to be the total taxable value of land and additions on the property. | Land | Improvement |
|---|---|---|---|---|
| 2024 | $2,368 | $106,850 | $22,400 | $84,450 |
| 2023 | $2,852 | $106,850 | $22,400 | $84,450 |
| 2022 | $2,589 | $95,400 | $22,400 | $73,000 |
| 2021 | $2,375 | $89,150 | $22,400 | $66,750 |
| 2020 | $2,344 | $89,150 | $22,400 | $66,750 |
| 2019 | $2,131 | $80,950 | $12,450 | $68,500 |
| 2018 | $2,312 | $80,950 | $12,450 | $68,500 |
| 2017 | $2,241 | $78,600 | $12,450 | $66,150 |
| 2016 | $2,031 | $76,300 | $12,450 | $63,850 |
| 2015 | $1,599 | $53,900 | $9,350 | $44,550 |
| 2014 | $1,646 | $53,900 | $9,350 | $44,550 |
| 2013 | $1,659 | $53,900 | $9,350 | $44,550 |
Source: Public Records
Map
Nearby Homes
- 601 10th St S
- 513 10th St S
- 820 10th St S Unit C20
- 1124 5th Ave S
- 1118 8th Ave S
- 505 8th St S
- 1020 9th Ave S
- 502 8th St S Unit 5
- 502 8th St S Unit 3
- 502 8th St S Unit 1
- 502 8th St S Unit 2
- 502 8th St S Unit 4
- 1121 4th Ave S
- 605 7th St S Unit 2
- 1024 3rd Ave S
- 910 University Dr S
- 911 8th St S
- 1117 3rd Ave S
- 220 8th St S Unit B2
- 220 8th St S Unit D4