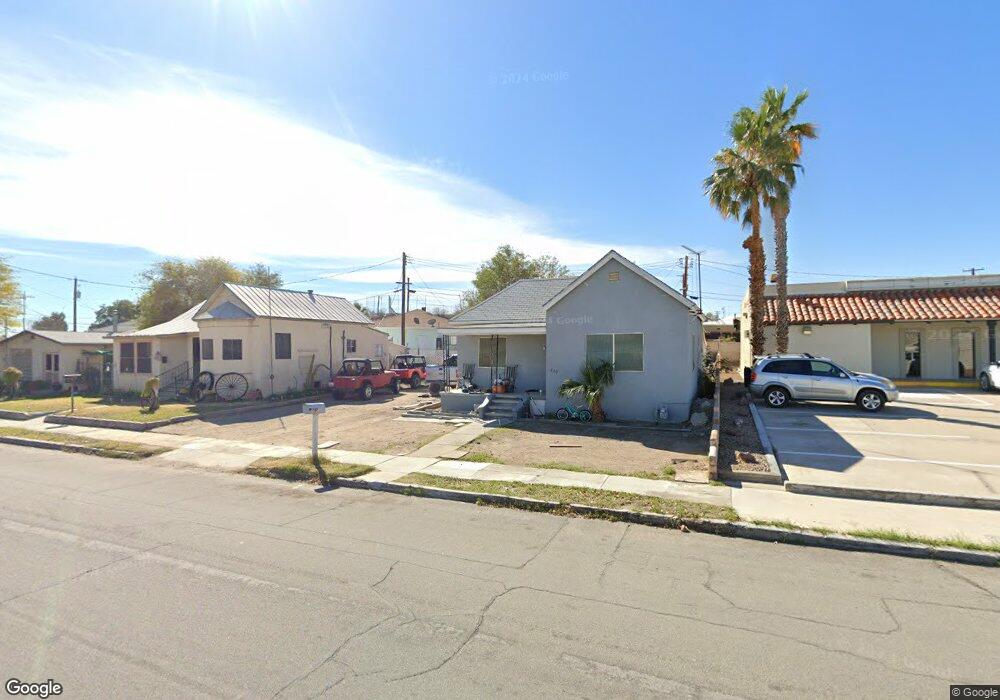
619 3rd St Needles, CA 92363
Estimated Value: $92,000 - $120,000
2
Beds
1
Bath
868
Sq Ft
$125/Sq Ft
Est. Value
About This Home
This home is located at 619 3rd St, Needles, CA 92363 and is currently estimated at $108,546, approximately $125 per square foot. 619 3rd St is a home located in San Bernardino County with nearby schools including Vista Colorado Elementary School, Chemehuevi Valley Elementary School, and Needles Middle School.
Ownership History
Date
Name
Owned For
Owner Type
Purchase Details
Closed on
May 5, 2023
Sold by
Diaz David
Bought by
Diaz Andre
Current Estimated Value
Purchase Details
Closed on
Sep 21, 2022
Sold by
Ralph T Diaz And Maria A Diaz Family Tru
Bought by
Diaz David
Purchase Details
Closed on
Mar 16, 2001
Sold by
West William F and West Dorothy S
Bought by
Maria A & Ralph T Diaz Family Trust
Home Financials for this Owner
Home Financials are based on the most recent Mortgage that was taken out on this home.
Original Mortgage
$20,000
Interest Rate
7.19%
Mortgage Type
Seller Take Back
Create a Home Valuation Report for This Property
The Home Valuation Report is an in-depth analysis detailing your home's value as well as a comparison with similar homes in the area
Home Values in the Area
Average Home Value in this Area
Purchase History
| Date | Buyer | Sale Price | Title Company |
|---|---|---|---|
| Diaz Andre | -- | None Listed On Document | |
| Diaz David | -- | -- | |
| Maria A & Ralph T Diaz Family Trust | $25,000 | -- |
Source: Public Records
Mortgage History
| Date | Status | Borrower | Loan Amount |
|---|---|---|---|
| Previous Owner | Maria A & Ralph T Diaz Family Trust | $20,000 |
Source: Public Records
Tax History
| Year | Tax Paid | Tax Assessment Tax Assessment Total Assessment is a certain percentage of the fair market value that is determined by local assessors to be the total taxable value of land and additions on the property. | Land | Improvement |
|---|---|---|---|---|
| 2025 | $900 | $66,600 | $25,500 | $41,100 |
| 2024 | $928 | $69,360 | $26,520 | $42,840 |
| 2023 | $992 | $65,000 | $25,000 | $40,000 |
| 2022 | $618 | $35,496 | $7,099 | $28,397 |
| 2021 | $608 | $34,800 | $6,960 | $27,840 |
| 2020 | $602 | $34,444 | $6,889 | $27,555 |
| 2019 | $605 | $33,769 | $6,754 | $27,015 |
| 2018 | $604 | $33,107 | $6,622 | $26,485 |
| 2017 | $587 | $32,458 | $6,492 | $25,966 |
| 2016 | $537 | $31,822 | $6,365 | $25,457 |
| 2015 | $415 | $31,344 | $6,269 | $25,075 |
| 2014 | $375 | $30,730 | $6,146 | $24,584 |
Source: Public Records
Map
Nearby Homes
- 222 C St
- 310 D St
- 608 W Broadway St
- 406 D St
- 0 Vacant Land Unit JT26035819
- 0 N A Unit S701893
- 501 B St
- 156 A St Unit 156
- 196 Thunderhead 2
- 518 A St
- 521 Desnok St
- 516 Palm Way
- 219 Cibola St
- 215 Cibola St
- 520 Quivera St
- 521 Quivera St
- 116 Thunderhead 1
- 120 Thunderhead 1
- 40 W Broadway St
- 1312 W Broadway St
Your Personal Tour Guide
Ask me questions while you tour the home.