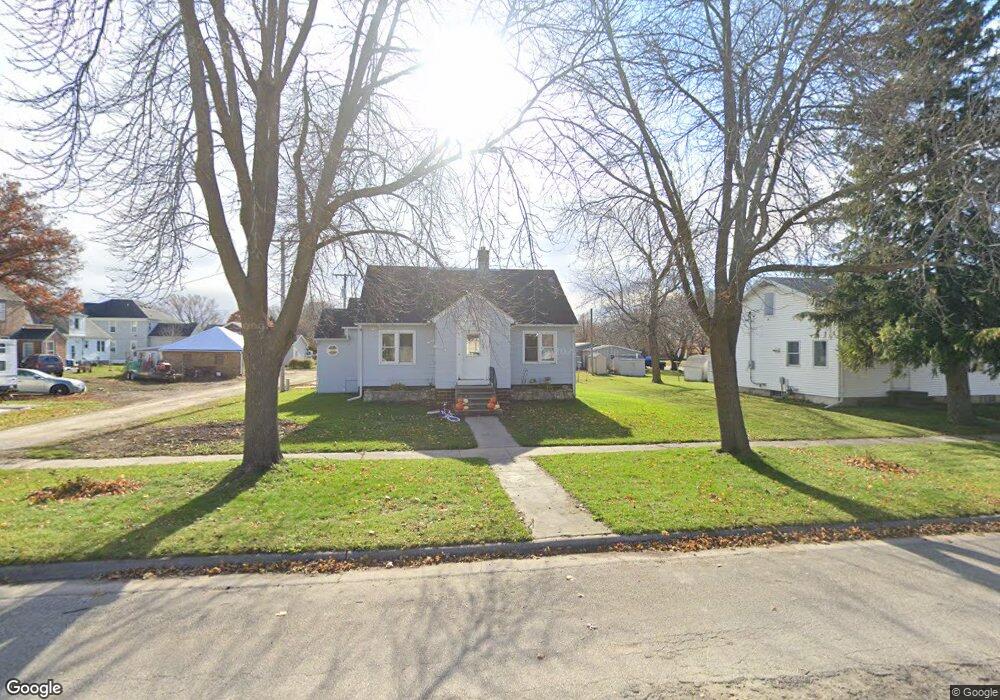
619 4th St Allison, IA 50602
Estimated Value: $72,000 - $113,000
2
Beds
2
Baths
936
Sq Ft
$100/Sq Ft
Est. Value
About This Home
This home is located at 619 4th St, Allison, IA 50602 and is currently estimated at $93,390, approximately $99 per square foot. 619 4th St is a home located in Butler County with nearby schools including North Butler Elementary and North Butler Junior/Senior High School.
Ownership History
Date
Name
Owned For
Owner Type
Purchase Details
Closed on
Aug 27, 2014
Sold by
Bank Of America N A
Bought by
Cordes Clayton J
Current Estimated Value
Purchase Details
Closed on
Jul 16, 2014
Sold by
Lawson Eric W and Lawson Rachel L
Bought by
Bank Of America N A
Purchase Details
Closed on
Aug 28, 2008
Sold by
Viogts Olive Caryl and Voigts Caryl
Bought by
Lawson Eric W and Lawson Rachel L
Create a Home Valuation Report for This Property
The Home Valuation Report is an in-depth analysis detailing your home's value as well as a comparison with similar homes in the area
Home Values in the Area
Average Home Value in this Area
Purchase History
| Date | Buyer | Sale Price | Title Company |
|---|---|---|---|
| Cordes Clayton J | $21,000 | None Available | |
| Bank Of America N A | $20,700 | None Available | |
| Lawson Eric W | -- | None Available |
Source: Public Records
Tax History Compared to Growth
Tax History
| Year | Tax Paid | Tax Assessment Tax Assessment Total Assessment is a certain percentage of the fair market value that is determined by local assessors to be the total taxable value of land and additions on the property. | Land | Improvement |
|---|---|---|---|---|
| 2024 | $1,142 | $65,580 | $9,360 | $56,220 |
| 2023 | $1,142 | $65,580 | $9,360 | $56,220 |
| 2022 | $1,086 | $58,880 | $9,360 | $49,520 |
| 2021 | $1,066 | $58,880 | $9,360 | $49,520 |
| 2020 | $1,066 | $52,940 | $9,360 | $43,580 |
| 2019 | $986 | $48,970 | $9,360 | $43,580 |
| 2018 | $1,052 | $48,970 | $0 | $0 |
| 2017 | $1,062 | $48,970 | $0 | $0 |
| 2016 | $1,036 | $46,550 | $0 | $0 |
| 2015 | $1,036 | $46,550 | $0 | $0 |
Source: Public Records
Map
Nearby Homes