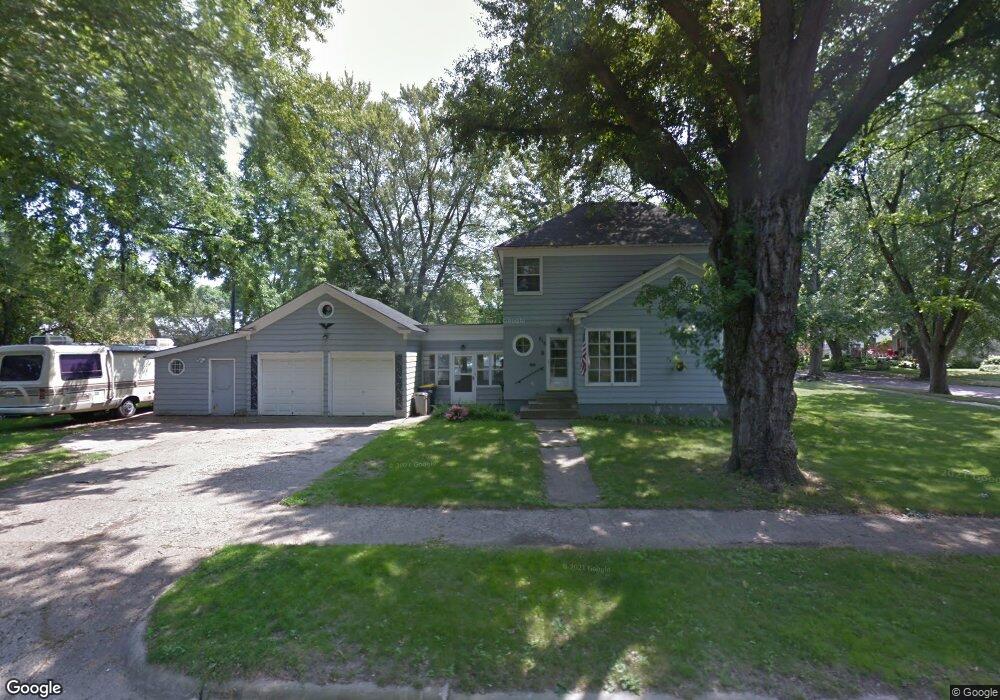
619 8th St SW Faribault, MN 55021
Estimated Value: $271,000 - $300,000
3
Beds
2
Baths
1,651
Sq Ft
$173/Sq Ft
Est. Value
About This Home
This home is located at 619 8th St SW, Faribault, MN 55021 and is currently estimated at $285,396, approximately $172 per square foot. 619 8th St SW is a home located in Rice County with nearby schools including Jefferson Elementary School, Faribault Middle School, and Faribault Senior High School.
Ownership History
Date
Name
Owned For
Owner Type
Purchase Details
Closed on
Dec 28, 2017
Sold by
Danielson Robert and Danielson Erica
Bought by
Mccarthy Devon
Current Estimated Value
Home Financials for this Owner
Home Financials are based on the most recent Mortgage that was taken out on this home.
Original Mortgage
$176,395
Outstanding Balance
$148,704
Interest Rate
3.9%
Mortgage Type
FHA
Estimated Equity
$136,692
Purchase Details
Closed on
May 8, 2015
Sold by
Henry Patricia Patricia
Bought by
Danielson Robert Robert
Home Financials for this Owner
Home Financials are based on the most recent Mortgage that was taken out on this home.
Original Mortgage
$121,000
Interest Rate
3.8%
Purchase Details
Closed on
Oct 1, 2007
Sold by
Jp Morgan Chase Bank
Bought by
Henry Brent E and Henry Patricia A
Purchase Details
Closed on
Jul 18, 2003
Sold by
Masson Allen J and Masson Carolynn M
Bought by
Schlecht Chad W
Create a Home Valuation Report for This Property
The Home Valuation Report is an in-depth analysis detailing your home's value as well as a comparison with similar homes in the area
Home Values in the Area
Average Home Value in this Area
Purchase History
| Date | Buyer | Sale Price | Title Company |
|---|---|---|---|
| Mccarthy Devon | $179,651 | None Available | |
| Danielson Robert Robert | $127,400 | -- | |
| Henry Brent E | $125,000 | -- | |
| Schlecht Chad W | $177,500 | -- |
Source: Public Records
Mortgage History
| Date | Status | Borrower | Loan Amount |
|---|---|---|---|
| Open | Mccarthy Devon | $176,395 | |
| Previous Owner | Danielson Robert Robert | $121,000 |
Source: Public Records
Tax History
| Year | Tax Paid | Tax Assessment Tax Assessment Total Assessment is a certain percentage of the fair market value that is determined by local assessors to be the total taxable value of land and additions on the property. | Land | Improvement |
|---|---|---|---|---|
| 2025 | $3,036 | $270,500 | $77,500 | $193,000 |
| 2024 | $3,036 | $250,600 | $73,200 | $177,400 |
| 2023 | $2,666 | $250,600 | $73,200 | $177,400 |
| 2022 | $2,416 | $231,200 | $68,900 | $162,300 |
| 2021 | $2,036 | $199,900 | $56,000 | $143,900 |
| 2020 | $1,838 | $172,100 | $53,800 | $118,300 |
| 2019 | $1,506 | $160,200 | $47,400 | $112,800 |
| 2018 | $1,444 | $139,900 | $37,500 | $102,400 |
| 2017 | $1,446 | $127,900 | $34,100 | $93,800 |
| 2016 | $1,402 | $124,900 | $34,100 | $90,800 |
| 2015 | $1,158 | $119,700 | $27,300 | $92,400 |
| 2014 | -- | $107,200 | $27,300 | $79,900 |
Source: Public Records
Map
Nearby Homes
- 836 7th Ave SW
- 330 5th Ave SW
- 832 Home Place
- 1124 8th Ave SW
- 127 4th Ave SW
- 945 Rice St
- 412 Prairie Ave SW
- 835 Westwood Dr
- 118 1st St SW
- 504 1st St NW
- 531 2nd St NW
- 521 2nd St NW
- 15 1st St SE
- 118 2nd Ave NW
- 1270 Aldrich Way
- 1425 4th St NW
- 1406 Albers Path
- 522 7th Ave NW
- 527 6th Ave NW
- 1319 George L St
- 813 7th Ave SW
- 804 804 6th-Avenue-sw
- 804 6th Ave SW
- 810 6th Ave SW
- 819 7th Ave SW
- 819 819 7th-Avenue-sw
- 616 8th St SW
- 804 7th Ave SW
- 814 6th Ave SW
- 814 814 6th-Avenue-sw
- 810 7th Ave SW
- 606 8th St SW
- 702 8th St SW
- 823 7th Ave SW
- 814 7th Ave SW
- 818 6th Ave SW
- 820 7th Ave SW
- 820 820 7th-Avenue-sw
- 708 8th St SW
- 720 6th Ave SW
Your Personal Tour Guide
Ask me questions while you tour the home.