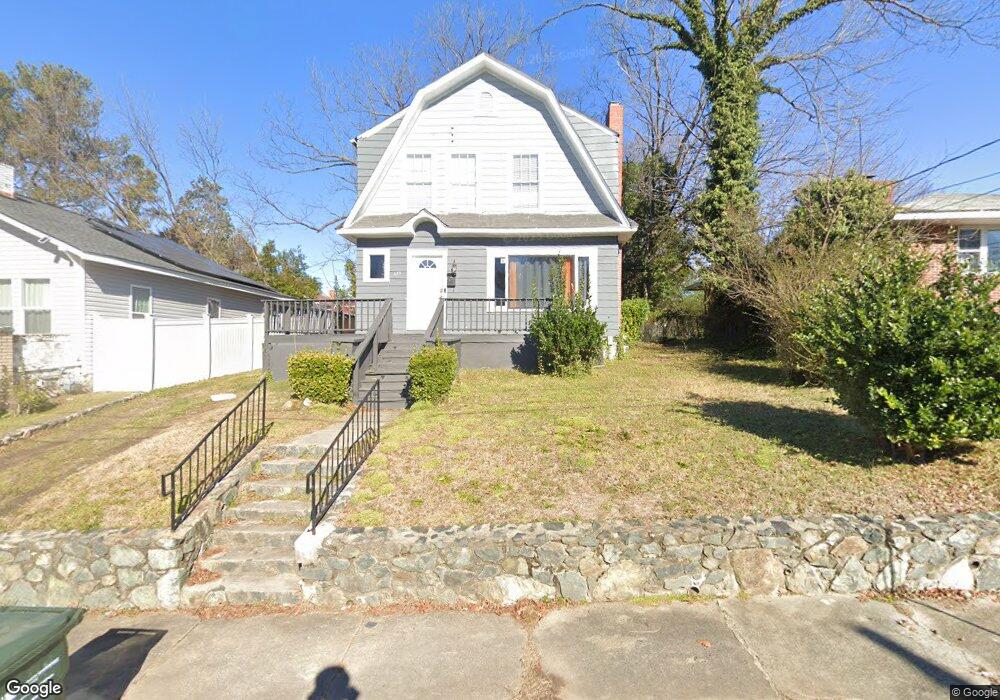
619 Dunbar St Durham, NC 27701
Hayti District NeighborhoodEstimated Value: $242,275 - $328,000
3
Beds
2
Baths
1,317
Sq Ft
$216/Sq Ft
Est. Value
About This Home
This home is located at 619 Dunbar St, Durham, NC 27701 and is currently estimated at $284,319, approximately $215 per square foot. 619 Dunbar St is a home located in Durham County with nearby schools including Canistota Elementary School, Fayetteville Street Elementary School, and James E. Shepard Middle School.
Ownership History
Date
Name
Owned For
Owner Type
Purchase Details
Closed on
Sep 4, 2019
Sold by
Richarson Rodney D
Bought by
Richardson Sylvia O
Current Estimated Value
Purchase Details
Closed on
Aug 27, 2019
Sold by
Butler Charlie and Butler Sandrea C
Bought by
Richardson Rodney D
Purchase Details
Closed on
Jan 30, 2007
Sold by
Ragland Lannie and Ragland Belinda F
Bought by
Butler Charlie and Butler Sandrea C
Home Financials for this Owner
Home Financials are based on the most recent Mortgage that was taken out on this home.
Original Mortgage
$53,000
Interest Rate
6.07%
Mortgage Type
Balloon
Create a Home Valuation Report for This Property
The Home Valuation Report is an in-depth analysis detailing your home's value as well as a comparison with similar homes in the area
Home Values in the Area
Average Home Value in this Area
Purchase History
| Date | Buyer | Sale Price | Title Company |
|---|---|---|---|
| Richardson Sylvia O | -- | None Available | |
| Richardson Rodney D | $60,000 | None Available | |
| Butler Charlie | $53,000 | None Available |
Source: Public Records
Mortgage History
| Date | Status | Borrower | Loan Amount |
|---|---|---|---|
| Previous Owner | Butler Charlie | $53,000 |
Source: Public Records
Tax History Compared to Growth
Tax History
| Year | Tax Paid | Tax Assessment Tax Assessment Total Assessment is a certain percentage of the fair market value that is determined by local assessors to be the total taxable value of land and additions on the property. | Land | Improvement |
|---|---|---|---|---|
| 2025 | $2,282 | $230,178 | $99,750 | $130,428 |
| 2024 | $1,059 | $75,895 | $22,800 | $53,095 |
| 2023 | $994 | $75,895 | $22,800 | $53,095 |
| 2022 | $971 | $75,895 | $22,800 | $53,095 |
| 2021 | $967 | $75,895 | $22,800 | $53,095 |
| 2020 | $944 | $75,895 | $22,800 | $53,095 |
| 2019 | $944 | $75,895 | $22,800 | $53,095 |
| 2018 | $662 | $48,798 | $11,400 | $37,398 |
| 2017 | $657 | $48,798 | $11,400 | $37,398 |
| 2016 | $635 | $48,798 | $11,400 | $37,398 |
| 2015 | $887 | $64,101 | $16,036 | $48,065 |
| 2014 | $887 | $64,101 | $16,036 | $48,065 |
Source: Public Records
Map
Nearby Homes