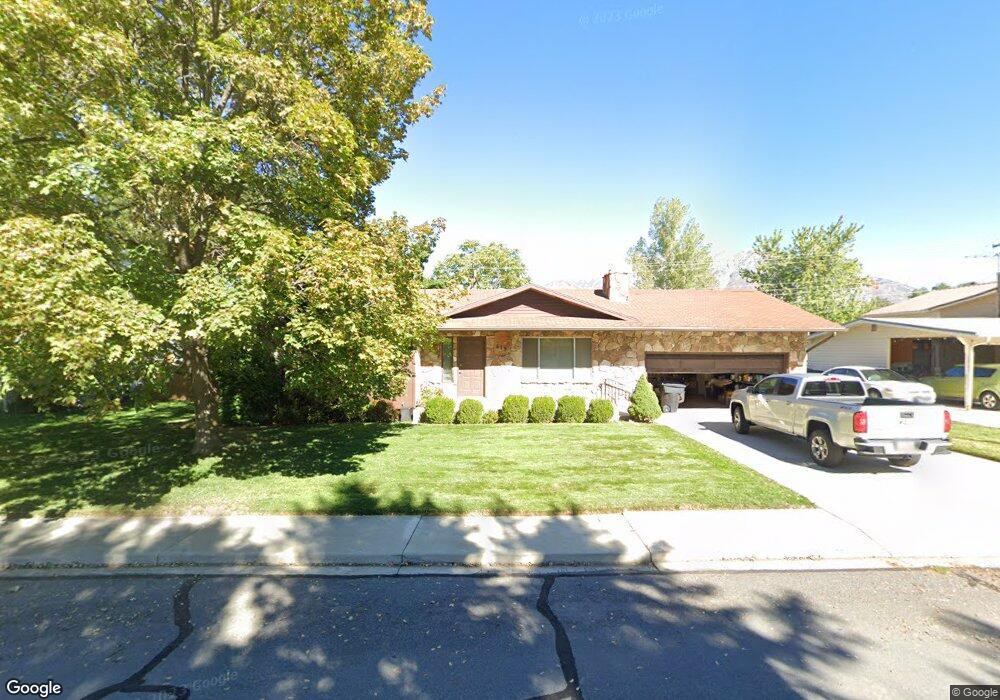
619 E 445 S Orem, UT 84097
SCERA NeighborhoodEstimated Value: $493,287 - $563,000
5
Beds
2
Baths
2,028
Sq Ft
$257/Sq Ft
Est. Value
About This Home
This home is located at 619 E 445 S, Orem, UT 84097 and is currently estimated at $521,762, approximately $257 per square foot. 619 E 445 S is a home located in Utah County with nearby schools including Centennial Elementary, Lakeridge Jr High School, and Orem High School.
Ownership History
Date
Name
Owned For
Owner Type
Purchase Details
Closed on
May 24, 2024
Sold by
Grover Bryan
Bought by
Grover Bryan and Grover Frances
Current Estimated Value
Home Financials for this Owner
Home Financials are based on the most recent Mortgage that was taken out on this home.
Original Mortgage
$444,260
Outstanding Balance
$438,031
Interest Rate
6.88%
Mortgage Type
New Conventional
Estimated Equity
$83,731
Purchase Details
Closed on
May 23, 2024
Sold by
Gerke Family Trust and Gerke Kim Bradley
Bought by
Grover Bryan
Home Financials for this Owner
Home Financials are based on the most recent Mortgage that was taken out on this home.
Original Mortgage
$444,260
Outstanding Balance
$438,031
Interest Rate
6.88%
Mortgage Type
New Conventional
Estimated Equity
$83,731
Purchase Details
Closed on
Mar 11, 1997
Sold by
Gerke Robert W and Gerke Ethel Maxine
Bought by
Gerke Robert W and Gerke Maxine
Create a Home Valuation Report for This Property
The Home Valuation Report is an in-depth analysis detailing your home's value as well as a comparison with similar homes in the area
Home Values in the Area
Average Home Value in this Area
Purchase History
| Date | Buyer | Sale Price | Title Company |
|---|---|---|---|
| Grover Bryan | -- | First American Title | |
| Grover Bryan | -- | First American Title Insurance | |
| Gerke Robert W | -- | -- |
Source: Public Records
Mortgage History
| Date | Status | Borrower | Loan Amount |
|---|---|---|---|
| Open | Grover Bryan | $444,260 |
Source: Public Records
Tax History
| Year | Tax Paid | Tax Assessment Tax Assessment Total Assessment is a certain percentage of the fair market value that is determined by local assessors to be the total taxable value of land and additions on the property. | Land | Improvement |
|---|---|---|---|---|
| 2025 | $1,836 | $234,960 | -- | -- |
| 2024 | $1,836 | $224,510 | $0 | $0 |
| 2023 | $1,699 | $223,245 | $0 | $0 |
| 2022 | $1,753 | $223,135 | $0 | $0 |
| 2021 | $552 | $315,100 | $128,600 | $186,500 |
| 2020 | $487 | $285,700 | $102,900 | $182,800 |
| 2019 | $1,371 | $270,200 | $96,000 | $174,200 |
| 2018 | $407 | $249,700 | $92,600 | $157,100 |
| 2017 | $586 | $130,460 | $0 | $0 |
| 2016 | $588 | $120,340 | $0 | $0 |
| 2015 | $572 | $111,375 | $0 | $0 |
| 2014 | $533 | $105,160 | $0 | $0 |
Source: Public Records
Map
Nearby Homes
Your Personal Tour Guide
Ask me questions while you tour the home.