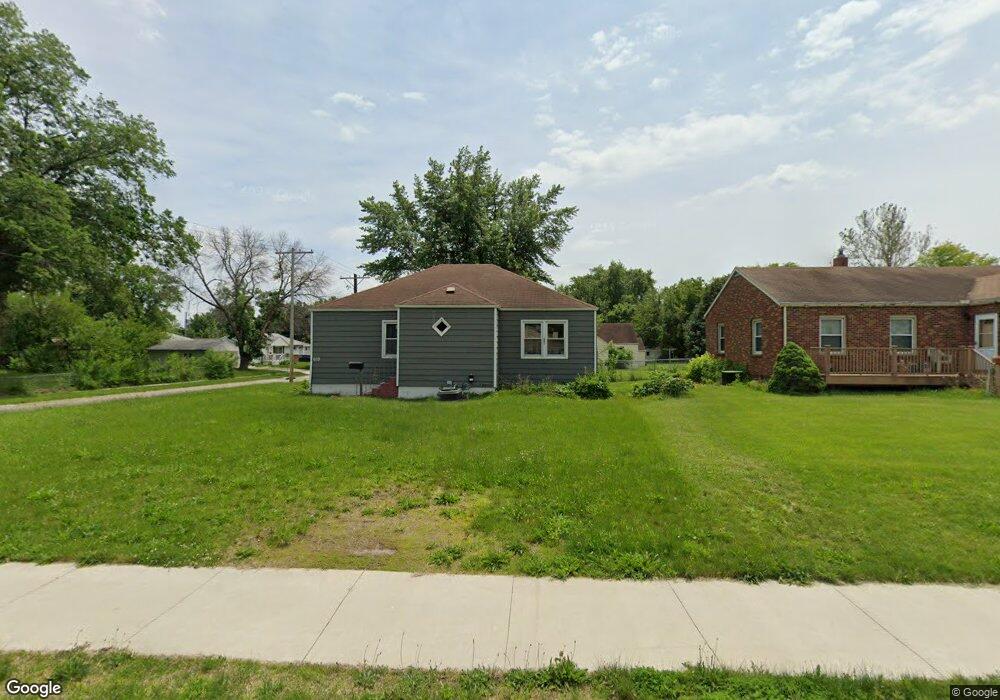
619 E Shawnee Ave Des Moines, IA 50313
Highland Park NeighborhoodEstimated Value: $190,630 - $224,000
3
Beds
1
Bath
1,063
Sq Ft
$195/Sq Ft
Est. Value
About This Home
This home is located at 619 E Shawnee Ave, Des Moines, IA 50313 and is currently estimated at $206,908, approximately $194 per square foot. 619 E Shawnee Ave is a home located in Polk County with nearby schools including Madison Elementary School, Harding Middle School, and North High School.
Ownership History
Date
Name
Owned For
Owner Type
Purchase Details
Closed on
Jun 22, 2009
Sold by
Vos Ronald Jo and Vos Lucille J
Bought by
Cangas Jacob E and Cangas Melody M
Current Estimated Value
Home Financials for this Owner
Home Financials are based on the most recent Mortgage that was taken out on this home.
Original Mortgage
$110,461
Outstanding Balance
$70,428
Interest Rate
4.94%
Mortgage Type
FHA
Estimated Equity
$136,480
Purchase Details
Closed on
Oct 28, 2005
Sold by
Davis Bret M
Bought by
Vos Ronald J and Vos Lucille J
Home Financials for this Owner
Home Financials are based on the most recent Mortgage that was taken out on this home.
Original Mortgage
$25,000
Interest Rate
5.61%
Mortgage Type
Stand Alone Second
Purchase Details
Closed on
Aug 31, 1999
Sold by
Marlow James W and Marlow Elizabeth
Bought by
Davis Bret M
Home Financials for this Owner
Home Financials are based on the most recent Mortgage that was taken out on this home.
Original Mortgage
$63,050
Interest Rate
7.59%
Create a Home Valuation Report for This Property
The Home Valuation Report is an in-depth analysis detailing your home's value as well as a comparison with similar homes in the area
Home Values in the Area
Average Home Value in this Area
Purchase History
| Date | Buyer | Sale Price | Title Company |
|---|---|---|---|
| Cangas Jacob E | $112,000 | None Available | |
| Vos Ronald J | $98,000 | -- | |
| Davis Bret M | $64,500 | -- |
Source: Public Records
Mortgage History
| Date | Status | Borrower | Loan Amount |
|---|---|---|---|
| Open | Cangas Jacob E | $110,461 | |
| Previous Owner | Vos Ronald J | $25,000 | |
| Previous Owner | Vos Ronald J | $73,500 | |
| Previous Owner | Davis Bret M | $63,050 |
Source: Public Records
Tax History Compared to Growth
Tax History
| Year | Tax Paid | Tax Assessment Tax Assessment Total Assessment is a certain percentage of the fair market value that is determined by local assessors to be the total taxable value of land and additions on the property. | Land | Improvement |
|---|---|---|---|---|
| 2025 | $3,166 | $193,500 | $35,700 | $157,800 |
| 2024 | $3,166 | $171,400 | $31,200 | $140,200 |
| 2023 | $2,984 | $171,400 | $31,200 | $140,200 |
| 2022 | $2,960 | $135,500 | $25,500 | $110,000 |
| 2021 | $2,752 | $135,500 | $25,500 | $110,000 |
| 2020 | $2,854 | $118,900 | $22,300 | $96,600 |
| 2019 | $2,560 | $118,900 | $22,300 | $96,600 |
| 2018 | $2,530 | $103,800 | $19,000 | $84,800 |
| 2017 | $2,360 | $103,800 | $19,000 | $84,800 |
| 2016 | $2,294 | $95,800 | $17,300 | $78,500 |
| 2015 | $2,294 | $95,800 | $17,300 | $78,500 |
| 2014 | $2,292 | $98,400 | $17,400 | $81,000 |
Source: Public Records
Map
Nearby Homes
- 4031 E 8th St
- 360 & 340 NE Aurora Ave
- 1022 Trisha Ave
- 4033 Cambridge St
- 1231 Jerlynn Ave
- 3832 Bowdoin St
- 3823 Bowdoin St
- 1140 NE 43rd Ave
- 3723 Wright St
- 3704 Wright St
- 3701 Amherst St
- 4145 1st St
- 139 E Seneca Ave
- 3623 Wright St
- 4132 1st St
- 4021 E 14th St
- 3938 1st St
- 3829 1st St
- 4024 2nd Ave
- 3623 Cambridge St
- 615 E Shawnee Ave
- 627 E Shawnee Ave
- 4030 N Union St
- 4021 N Union St
- 631 E Shawnee Ave
- 4028 N Union St
- 4037 Amherst St
- 4106 N Union St
- 634 Jerlynn Ave
- 630 E Shawnee Ave
- 4033 Amherst St
- 635 E Shawnee Ave
- 4024 N Union St
- 4110 N Union St
- 638 Jerlynn Ave
- 634 E Shawnee Ave
- 4029 Amherst St
- 4112 N Union St
- 4025 Amherst St
- 4109 Amherst St