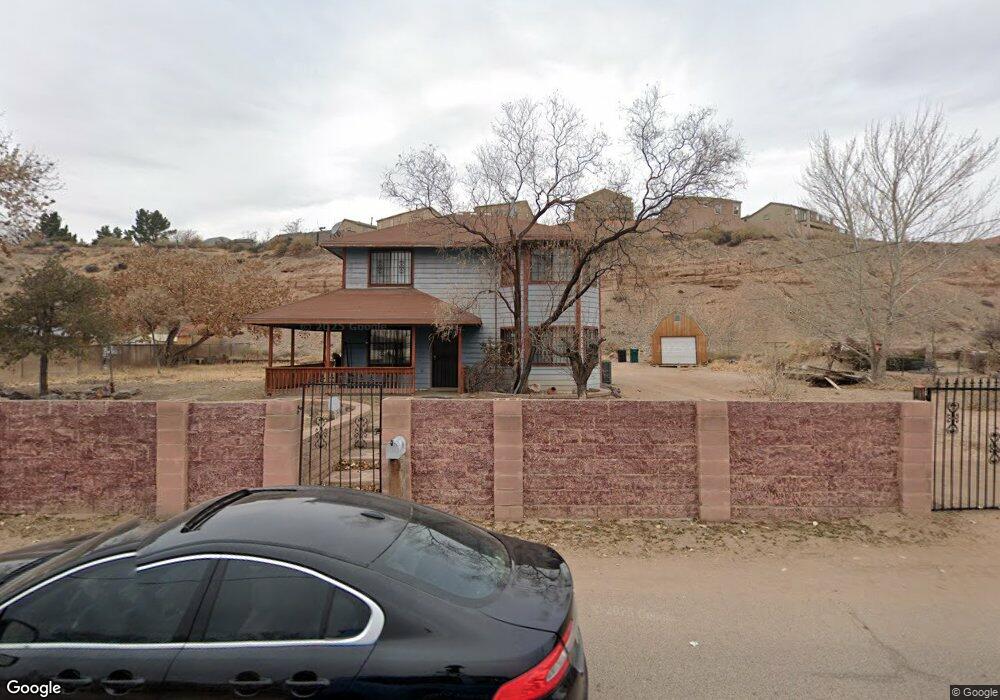
619 Foothill Dr SW Albuquerque, NM 87105
Estimated Value: $251,000 - $313,000
3
Beds
3
Baths
1,560
Sq Ft
$184/Sq Ft
Est. Value
About This Home
This home is located at 619 Foothill Dr SW, Albuquerque, NM 87105 and is currently estimated at $286,809, approximately $183 per square foot. 619 Foothill Dr SW is a home located in Bernalillo County with nearby schools including Valle Vista Elementary School, Ernie Pyle Middle School, and Rio Grande High School.
Ownership History
Date
Name
Owned For
Owner Type
Purchase Details
Closed on
Mar 5, 2014
Sold by
Romero Stanley
Bought by
Esquibel Elizabeth Francis
Current Estimated Value
Home Financials for this Owner
Home Financials are based on the most recent Mortgage that was taken out on this home.
Original Mortgage
$94,534
Outstanding Balance
$73,068
Interest Rate
4.87%
Mortgage Type
FHA
Estimated Equity
$213,741
Purchase Details
Closed on
Sep 28, 2005
Sold by
Romero Stanley and Esquibel Elizabeth F
Bought by
Romero Stanley and Esquibel Elizabeth F
Home Financials for this Owner
Home Financials are based on the most recent Mortgage that was taken out on this home.
Original Mortgage
$109,620
Interest Rate
5.76%
Mortgage Type
FHA
Purchase Details
Closed on
Jul 28, 2002
Sold by
Romero Rosemary
Bought by
Romero Stanley
Create a Home Valuation Report for This Property
The Home Valuation Report is an in-depth analysis detailing your home's value as well as a comparison with similar homes in the area
Home Values in the Area
Average Home Value in this Area
Purchase History
| Date | Buyer | Sale Price | Title Company |
|---|---|---|---|
| Esquibel Elizabeth Francis | -- | None Available | |
| Romero Stanley | -- | Us Title | |
| Romero Stanley | -- | Rio Grande Title |
Source: Public Records
Mortgage History
| Date | Status | Borrower | Loan Amount |
|---|---|---|---|
| Open | Esquibel Elizabeth Francis | $94,534 | |
| Previous Owner | Romero Stanley | $109,620 |
Source: Public Records
Tax History Compared to Growth
Tax History
| Year | Tax Paid | Tax Assessment Tax Assessment Total Assessment is a certain percentage of the fair market value that is determined by local assessors to be the total taxable value of land and additions on the property. | Land | Improvement |
|---|---|---|---|---|
| 2024 | $1,025 | $39,022 | $11,886 | $27,136 |
| 2023 | $1,004 | $37,886 | $11,541 | $26,345 |
| 2022 | $964 | $36,783 | $11,205 | $25,578 |
| 2021 | $926 | $35,711 | $10,878 | $24,833 |
| 2020 | $906 | $34,672 | $10,562 | $24,110 |
| 2019 | $874 | $33,662 | $10,254 | $23,408 |
| 2018 | $837 | $33,662 | $10,254 | $23,408 |
| 2017 | $806 | $32,682 | $9,956 | $22,726 |
| 2016 | $811 | $31,964 | $9,666 | $22,298 |
| 2015 | $37,644 | $37,644 | $10,056 | $27,588 |
| 2014 | $947 | $36,548 | $9,763 | $26,785 |
| 2013 | -- | $35,484 | $9,479 | $26,005 |
Source: Public Records
Map
Nearby Homes
- 5301 Los Abuelos Ct SW
- 721 Foothill Dr SW Unit A
- 5308 White Reserve Ave SW
- 714 City View Dr SW
- 2234 Hooper Rd SW
- 513 53rd St SW
- 618 Dolores Dr SW
- 1740 Garden Way SW
- 1736 Garden Way SW
- 302 Crestview Dr SW
- 1723 Garden Way SW
- 305 56th St SW
- 5948 Carlos Rey Cir SW
- 209 52nd St SW
- 512 Twilight Vista Ln SW
- 1829 Mae Ave SW
- 6208 Gonzales Rd SW
- 1911 Poplar Ln SW
- 135 57th St SW
- 501 Whitten Trail SW
- 625 Foothill Dr SW
- 613 Foothill Dr SW
- 703 Foothill Dr SW
- 5320 Los Abuelos Ct SW
- 5316 Los Abuelos Ct SW
- 5316 Los Abuelos Place SW
- 617 Foothill Rd SW
- 5320 Los Abuelos Place SW
- 5324 Los Abuelos Ct SW
- 5312 Los Abuelos Ct SW
- 5312 Los Abuelos Place SW
- 5328 Los Abuelos Ct SW
- 5308 Los Abuelos Ct SW
- 650 Foothill Dr SW
- 640 Foothill Dr SW
- 5332 Los Abuelos Ct SW
- 5332 Los Abuelos Place SW
- 707 Foothill Rd SW
- 700 Foothill Dr SW