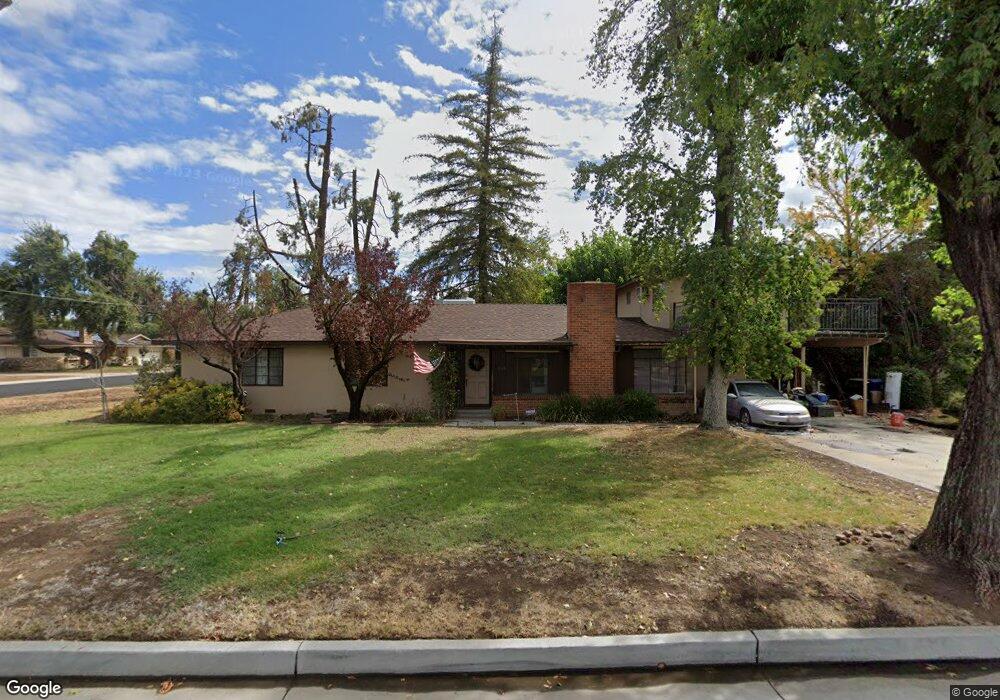
619 Foster Ave Madera, CA 93637
West Madera NeighborhoodEstimated Value: $416,000 - $504,000
4
Beds
4
Baths
2,202
Sq Ft
$207/Sq Ft
Est. Value
About This Home
This home is located at 619 Foster Ave, Madera, CA 93637 and is currently estimated at $456,727, approximately $207 per square foot. 619 Foster Ave is a home located in Madera County with nearby schools including John Adams Elementary School, Thomas Jefferson Middle School, and Madera High School.
Ownership History
Date
Name
Owned For
Owner Type
Purchase Details
Closed on
Jul 8, 2014
Sold by
Rigby John
Bought by
Rigby Charles and Rigby Clarissa
Current Estimated Value
Home Financials for this Owner
Home Financials are based on the most recent Mortgage that was taken out on this home.
Original Mortgage
$140,000
Interest Rate
4.1%
Mortgage Type
Seller Take Back
Purchase Details
Closed on
Aug 2, 2013
Sold by
Rigby Mitchell and The Nanette Rigby Trust
Bought by
Rigby John
Purchase Details
Closed on
Oct 11, 2012
Sold by
Rigby Nanette and The Rodger Rigby & Nanette Rig
Bought by
Rigby Nanette and The Nanette Rigby Trust
Create a Home Valuation Report for This Property
The Home Valuation Report is an in-depth analysis detailing your home's value as well as a comparison with similar homes in the area
Home Values in the Area
Average Home Value in this Area
Purchase History
| Date | Buyer | Sale Price | Title Company |
|---|---|---|---|
| Rigby Charles | $140,000 | Chicago Title Company | |
| Rigby John | -- | None Available | |
| Rigby Nanette | -- | None Available |
Source: Public Records
Mortgage History
| Date | Status | Borrower | Loan Amount |
|---|---|---|---|
| Previous Owner | Rigby Charles | $140,000 |
Source: Public Records
Tax History Compared to Growth
Tax History
| Year | Tax Paid | Tax Assessment Tax Assessment Total Assessment is a certain percentage of the fair market value that is determined by local assessors to be the total taxable value of land and additions on the property. | Land | Improvement |
|---|---|---|---|---|
| 2025 | $749 | $69,358 | $15,160 | $54,198 |
| 2023 | $749 | $66,667 | $14,572 | $52,095 |
| 2022 | $699 | $65,361 | $14,287 | $51,074 |
| 2021 | $685 | $64,080 | $14,007 | $50,073 |
| 2020 | $696 | $63,424 | $13,864 | $49,560 |
| 2019 | $689 | $62,182 | $13,593 | $48,589 |
| 2018 | $637 | $60,964 | $13,327 | $47,637 |
| 2017 | $628 | $59,769 | $13,066 | $46,703 |
| 2016 | $611 | $58,598 | $12,810 | $45,788 |
| 2015 | $592 | $57,719 | $12,618 | $45,101 |
| 2014 | $612 | $56,589 | $12,371 | $44,218 |
Source: Public Records
Map
Nearby Homes