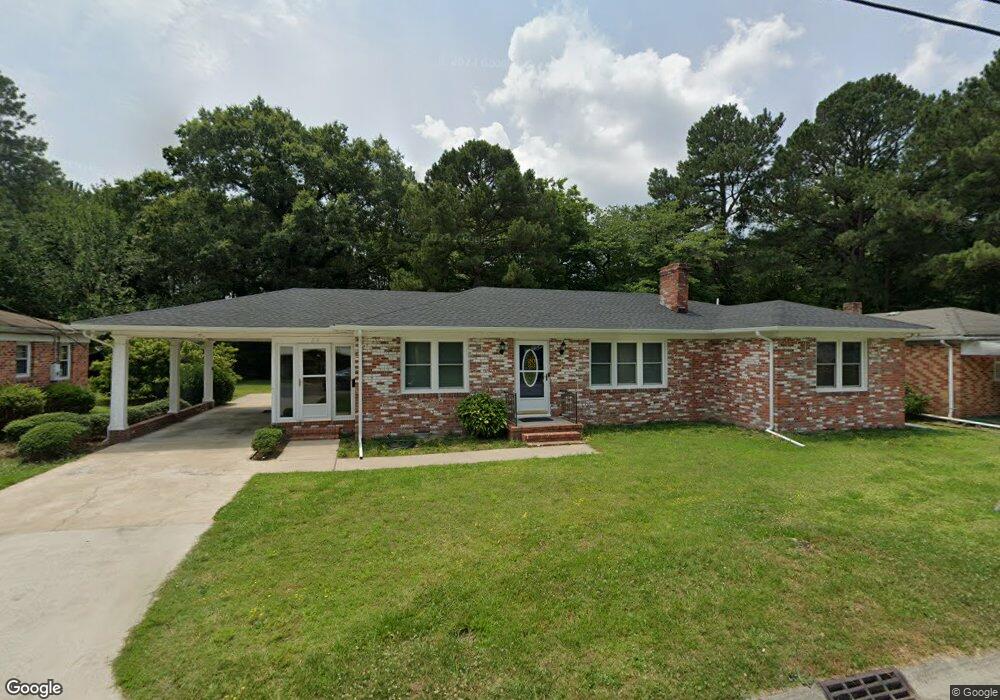
619 Kilby Ave Suffolk, VA 23434
Holy Neck NeighborhoodEstimated Value: $236,000 - $303,000
3
Beds
2
Baths
1,422
Sq Ft
$193/Sq Ft
Est. Value
About This Home
This home is located at 619 Kilby Ave, Suffolk, VA 23434 and is currently estimated at $274,869, approximately $193 per square foot. 619 Kilby Ave is a home located in Suffolk City with nearby schools including Hillpoint Elementary School, Forest Glen Middle School, and Lakeland High School.
Ownership History
Date
Name
Owned For
Owner Type
Purchase Details
Closed on
Jul 20, 2022
Sold by
Steven Warren
Bought by
Robertson Jackie Mccoy
Current Estimated Value
Home Financials for this Owner
Home Financials are based on the most recent Mortgage that was taken out on this home.
Original Mortgage
$271,600
Outstanding Balance
$258,707
Interest Rate
5.23%
Mortgage Type
New Conventional
Estimated Equity
$16,162
Purchase Details
Closed on
Mar 7, 2022
Sold by
Silver Derrick R
Bought by
Warren Steven
Create a Home Valuation Report for This Property
The Home Valuation Report is an in-depth analysis detailing your home's value as well as a comparison with similar homes in the area
Home Values in the Area
Average Home Value in this Area
Purchase History
| Date | Buyer | Sale Price | Title Company |
|---|---|---|---|
| Robertson Jackie Mccoy | $280,000 | Chicago Title | |
| Warren Steven | $113,850 | Insight Title |
Source: Public Records
Mortgage History
| Date | Status | Borrower | Loan Amount |
|---|---|---|---|
| Open | Robertson Jackie Mccoy | $271,600 |
Source: Public Records
Tax History Compared to Growth
Tax History
| Year | Tax Paid | Tax Assessment Tax Assessment Total Assessment is a certain percentage of the fair market value that is determined by local assessors to be the total taxable value of land and additions on the property. | Land | Improvement |
|---|---|---|---|---|
| 2024 | $3,214 | $250,000 | $50,000 | $200,000 |
| 2023 | $3,068 | $239,000 | $47,600 | $191,400 |
| 2022 | $1,296 | $118,900 | $34,000 | $84,900 |
| 2021 | $1,244 | $112,100 | $27,200 | $84,900 |
| 2020 | $1,134 | $102,200 | $24,800 | $77,400 |
| 2019 | $1,134 | $102,200 | $24,800 | $77,400 |
| 2018 | $1,264 | $101,800 | $24,800 | $77,000 |
| 2017 | $1,089 | $101,800 | $24,800 | $77,000 |
| 2016 | $1,089 | $101,800 | $24,800 | $77,000 |
| 2015 | $684 | $105,500 | $24,800 | $80,700 |
| 2014 | $684 | $105,500 | $24,800 | $80,700 |
Source: Public Records
Map
Nearby Homes