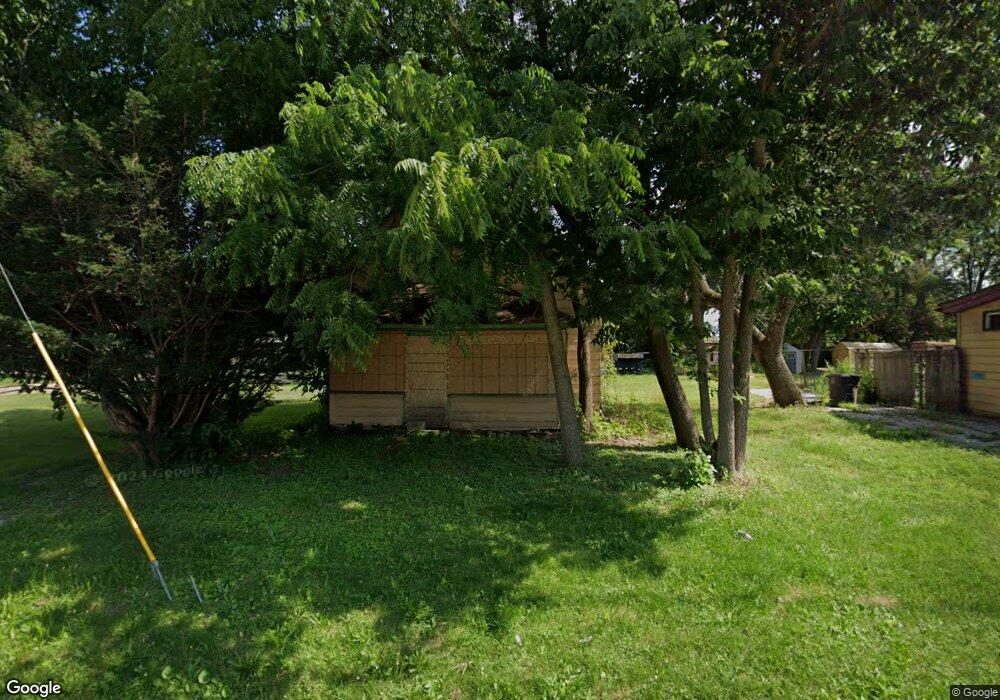
619 Maury St Des Moines, IA 50309
East Village NeighborhoodEstimated Value: $101,000 - $202,000
--
Bed
1
Bath
972
Sq Ft
$163/Sq Ft
Est. Value
About This Home
This home is located at 619 Maury St, Des Moines, IA 50309 and is currently estimated at $158,327, approximately $162 per square foot. 619 Maury St is a home located in Polk County with nearby schools including Carver Elementary School, Hiatt Middle School, and East High School.
Ownership History
Date
Name
Owned For
Owner Type
Purchase Details
Closed on
Oct 21, 2015
Sold by
Leff Scott
Bought by
Conn David
Current Estimated Value
Purchase Details
Closed on
Oct 1, 2015
Sold by
Frank Tristan
Bought by
Tf 16 Ccsb Llc
Purchase Details
Closed on
Nov 21, 2013
Sold by
Frank Tristan
Bought by
Scott Leff Roth 401K Trust
Purchase Details
Closed on
Sep 14, 2012
Sold by
County Of Polk
Bought by
Frank Tristan
Purchase Details
Closed on
Aug 24, 2004
Sold by
Clay Thomas
Bought by
Heard Pamela
Create a Home Valuation Report for This Property
The Home Valuation Report is an in-depth analysis detailing your home's value as well as a comparison with similar homes in the area
Home Values in the Area
Average Home Value in this Area
Purchase History
| Date | Buyer | Sale Price | Title Company |
|---|---|---|---|
| Conn David | $6,000 | None Available | |
| Tf 16 Ccsb Llc | -- | None Available | |
| Scott Leff Roth 401K Trust | -- | None Available | |
| Frank Tristan | -- | None Available | |
| Heard Pamela | -- | -- |
Source: Public Records
Tax History Compared to Growth
Tax History
| Year | Tax Paid | Tax Assessment Tax Assessment Total Assessment is a certain percentage of the fair market value that is determined by local assessors to be the total taxable value of land and additions on the property. | Land | Improvement |
|---|---|---|---|---|
| 2024 | $1,402 | $71,300 | $15,200 | $56,100 |
| 2023 | $1,440 | $71,300 | $15,200 | $56,100 |
| 2022 | $3,681 | $61,100 | $13,400 | $47,700 |
| 2021 | $1,755 | $61,100 | $13,400 | $47,700 |
| 2020 | $2,009 | $56,700 | $12,500 | $44,200 |
| 2019 | $2,008 | $56,700 | $12,500 | $44,200 |
| 2018 | $1,402 | $52,700 | $11,600 | $41,100 |
| 2017 | $1,350 | $52,700 | $11,600 | $41,100 |
| 2016 | $1,314 | $49,900 | $10,800 | $39,100 |
| 2015 | $1,314 | $49,900 | $10,800 | $39,100 |
| 2014 | $1,224 | $46,100 | $9,800 | $36,300 |
Source: Public Records
Map
Nearby Homes
- 825 SE 8th St
- 905 Shaw St
- 525 SE 9th St
- 811 SE 11th St
- 815 SE 11th St
- 819 SE 11th St
- 823 SE 11th St
- 317 E Jackson Ave
- 436 E Granger Ave
- 821 E Jackson Ave
- 409 E Granger Ave
- 200 E Granger Ave
- 301 E Court Ave Unit 207
- 301 E Court Ave Unit 203
- 808 E Dunham Ave
- 800 E Edison Ave
- 818 E Edison Ave
- 816 E Edison Ave
- 814 E Edison Ave
- 100 Market St Unit 407