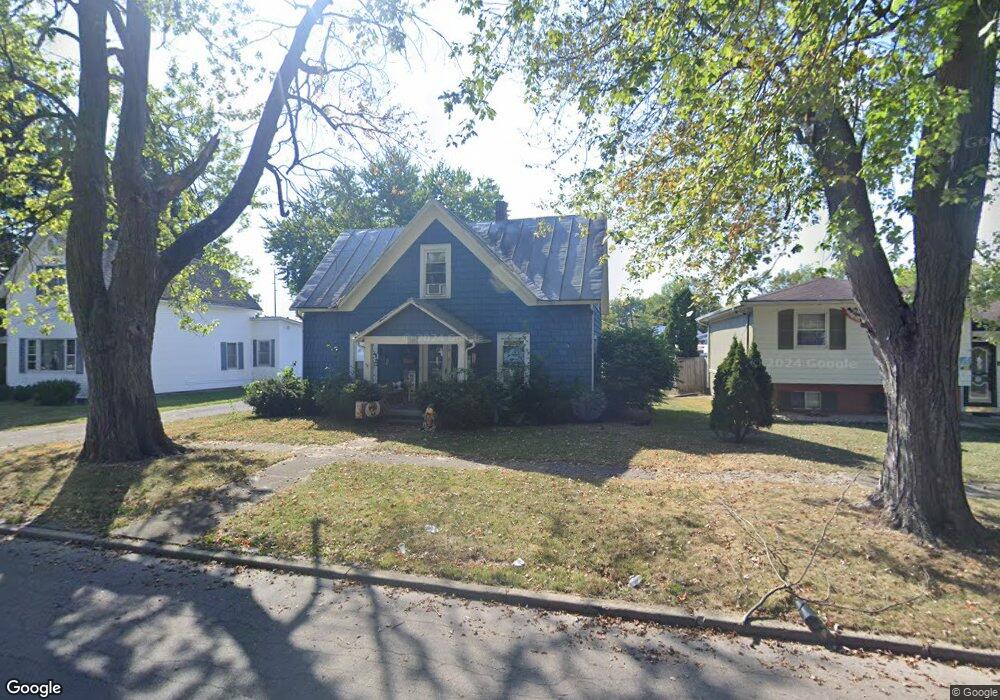
619 N East St Winchester, IN 47394
Estimated Value: $91,000 - $131,000
3
Beds
1
Bath
999
Sq Ft
$110/Sq Ft
Est. Value
About This Home
This home is located at 619 N East St, Winchester, IN 47394 and is currently estimated at $109,790, approximately $109 per square foot. 619 N East St is a home located in Randolph County with nearby schools including Winchester Community High School.
Ownership History
Date
Name
Owned For
Owner Type
Purchase Details
Closed on
Jun 11, 2021
Sold by
West Craig T and West Julie J
Bought by
Craig T West And Julie West Revocable Living and West
Current Estimated Value
Purchase Details
Closed on
Sep 1, 2017
Sold by
Jackson Steven and Ratliff Logan
Bought by
West Craig T and West Julie
Purchase Details
Closed on
May 18, 2007
Sold by
Federal National Mortgage Association
Bought by
West Craig T and West Julie
Home Financials for this Owner
Home Financials are based on the most recent Mortgage that was taken out on this home.
Original Mortgage
$42,000
Interest Rate
6.22%
Mortgage Type
Purchase Money Mortgage
Purchase Details
Closed on
Mar 14, 2007
Sold by
Phh Mortgage Corp
Bought by
Federal National Mortgage Association
Purchase Details
Closed on
Feb 20, 2007
Sold by
Morris Michael A
Bought by
Phh Mortgage Corp
Purchase Details
Closed on
Aug 15, 2005
Sold by
Cornett Paul E and Cornett Teresa A
Bought by
Morris Michael A
Home Financials for this Owner
Home Financials are based on the most recent Mortgage that was taken out on this home.
Original Mortgage
$50,400
Interest Rate
5.69%
Mortgage Type
Purchase Money Mortgage
Create a Home Valuation Report for This Property
The Home Valuation Report is an in-depth analysis detailing your home's value as well as a comparison with similar homes in the area
Home Values in the Area
Average Home Value in this Area
Purchase History
| Date | Buyer | Sale Price | Title Company |
|---|---|---|---|
| Craig T West And Julie West Revocable Living | -- | Starbuck Dane | |
| West Craig T | -- | None Available | |
| West Craig T | -- | Title One | |
| Federal National Mortgage Association | -- | None Available | |
| Phh Mortgage Corp | $46,452 | None Available | |
| Morris Michael A | -- | None Available |
Source: Public Records
Mortgage History
| Date | Status | Borrower | Loan Amount |
|---|---|---|---|
| Previous Owner | West Craig T | $42,000 | |
| Previous Owner | Morris Michael A | $50,400 |
Source: Public Records
Tax History Compared to Growth
Tax History
| Year | Tax Paid | Tax Assessment Tax Assessment Total Assessment is a certain percentage of the fair market value that is determined by local assessors to be the total taxable value of land and additions on the property. | Land | Improvement |
|---|---|---|---|---|
| 2024 | $1,358 | $67,900 | $8,000 | $59,900 |
| 2023 | $1,308 | $65,400 | $8,000 | $57,400 |
| 2022 | $1,250 | $62,500 | $7,200 | $55,300 |
| 2021 | $1,148 | $57,400 | $10,100 | $47,300 |
| 2020 | $1,090 | $54,500 | $9,600 | $44,900 |
| 2019 | $1,066 | $53,300 | $9,600 | $43,700 |
| 2018 | $1,178 | $58,900 | $8,700 | $50,200 |
| 2017 | $537 | $55,400 | $7,600 | $47,800 |
| 2016 | $504 | $53,800 | $7,200 | $46,600 |
| 2014 | $974 | $48,700 | $7,200 | $41,500 |
| 2013 | $974 | $46,900 | $7,200 | $39,700 |
Source: Public Records
Map
Nearby Homes
- 544 N Main St
- 508 N West St
- 501 N Maple St
- 317 E North St
- 521 E Short St
- 625 E Beech St
- Multiple Adresses Unit See Remarks
- TBD Progress Blvd
- 706 W Washington St
- 424 E South St
- 326 S Meridian St
- 527 W South St
- 410 E Thompson St
- 622 W South St
- 1071 N Old Highway 27
- 504 S Meridian St
- 114 E Orange St
- 315 W Orange St
- 613 S Main St
- 742 S Huntsville Rd